How to measure real visitor speed
Lab tests measure one machine on one connection. Real-user monitoring records what your actual visitors experienced, on their own devices, in their own browsers.
A PageSpeed score tells you how fast your site was for one machine, on one connection, once. Your visitors are on phones with patchy signal, old laptops, and networks you’ll never test. Real-user monitoring records what actually happened for them — measured in their browser, reported to your own database.
Where to find it
- In your WordPress admin, click xSpeed Cache in the left menu.
- In the xSpeed Cache sidebar, open the Health & insights group.
- Click the Health card, then the Visitors tab.
Shortcut: open
wp-admin/admin.php?page=xspeed#/insights/health/visitorsdirectly.⭐ This tab is part of xSpeed Pro.
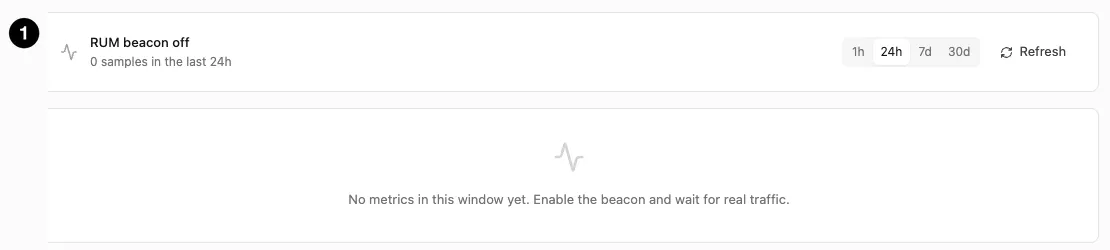
- Beacon status — whether it’s on, sample count, and the time-range selector.
Settings at a glance
| Setting | Default | What it does |
|---|---|---|
| Enable RUM beacon | Off | Load a ~1 KB script that reports real page-load metrics. |
| Sample rate (%) | 100 | What fraction of pageviews are recorded. |
| Exclude logged-in users | On | Skip editors and admins so their uncached loads don’t skew results. |
How it works
With the beacon on, a ~1 KB script loads on your front end. As each page finishes loading it measures the real timings and sends them to your own database — the panel is explicit that there are no third parties involved. Nothing leaves your site.
You then view the results over 1h / 24h / 7d / 30d windows, with Refresh to pull the latest.
Expect it to say “No metrics in this window yet” at first. The beacon only records page loads that happen after you enable it, so there’s no history to backfill. On a quiet site it takes a while to accumulate anything meaningful.
The three settings
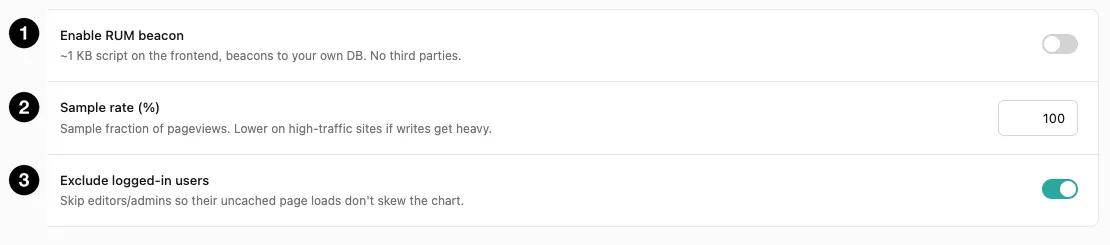
- Enable RUM beacon — the master switch.
- Sample rate (%) — what fraction of pageviews to record.
- Exclude logged-in users — keep your own visits out of the data.
Sample rate defaults to 100, meaning every pageview is recorded. That’s right for most sites and gives the most complete picture.
Lower it on high-traffic sites if writes get heavy — each recorded pageview is a database write, and at very high traffic that adds up. Sampling 10% of a busy site still gives statistically sound numbers while cutting writes by 90%. On a normal site there’s no reason to reduce it.
Exclude logged-in users is on by default, and this one genuinely matters for data quality. You and your editors are never served cached pages — that’s how Page Cache works. So your page loads are systematically slower than a real visitor’s, and including them would drag your averages down while telling you nothing about the experience you’re trying to measure.
💡 Leave the exclusion on. Without it, a day of heavy editing can make your site look markedly slower than it is for actual visitors. The people generating the most pageviews on a small site are often its editors.
Reading the results
The value of RUM is that it captures the spread, not just an average. Real-world data has a long tail — most visitors are fine, some are on a train with one bar of signal — and it’s that tail where problems hide.
This is also the honest counterweight to lab scores. A perfect PageSpeed result and mediocre real-user numbers usually means your test conditions are kinder than your visitors’ conditions. When the two disagree, RUM is the one describing reality.