How to read your dashboard
The first screen xSpeed shows you — your speed score, what caching is actually doing, what to fix next, and which features are on — and what each number really means.
Overview is where xSpeed opens. It answers four questions in one screen: how fast is this site, is caching actually working, what should I fix next, and what have I got switched on. Nothing here is a setting — every number is a reading, and every button sends you to the panel that owns it.
Where to find it
- In your WordPress admin, click xSpeed Cache in the left menu.
- You’re already here — Overview is the default landing page.
Shortcut: open
wp-admin/admin.php?page=xspeed#/overviewdirectly.✅ This panel is part of xSpeed Cache (Free).

- Your speed score — with the device toggle and View details.
- Connect to Hub — manage this and other sites remotely.
Settings at a glance
This panel stores nothing. It reads from the modules and links out to them:
| Element | What it shows |
|---|---|
| Speed score | Lighthouse performance from your most recent scan, with a mobile / desktop toggle. |
| xSpeed Hub | Whether this site is connected for remote management. |
| AI connection | Whether an AI agent can reach this site over MCP. |
| Metric grid | Hit ratio, cached pages, cache size, and average saving. |
| Free GTmetrix test | Shown when xSpeed Hub can test this site — connect, or run a test from your monthly allowance. |
| Recommended for your site | Ranked actions, each with a button that opens the right panel. |
| Your setup | Which features are on, off or licence-locked, grouped by area. |
| Recent activity | The latest settings changes and purges. |
How it works
Overview is assembled when you open it, and stores nothing of its own. The dashboard’s startup data supplies the cache status, the metric counters and the list of modules. Each card then fetches its own reading separately — the latest scan score, the Hub and MCP connection state, the last cache benchmark, the recommendations and the activity log — so the page doesn’t wait for every reading before showing any of them.
Nothing on the page refreshes on a timer. Every figure is as fresh as the moment the page loaded, which is why the readings that can go stale say how old they are: the score names its age, and Last purged gives the age of your cache. Reload the page to read everything again.
Recommended for your site comes from the free plugin’s own rule-based checks of your current settings, plus a check of whether your server rewrite is actually routing to the cache. The Health panel’s Pro recommendations run a separate scan of their own. On a licensed install, findings from the Pro audit are folded in underneath as quieter notes.
When xSpeed Hub can run a test for this site, a free GTmetrix test card also appears below the metrics — an invitation to connect if the site isn’t connected yet, or the test button with your remaining monthly allowance if it is. It stays hidden when the Hub can’t serve this site, rather than showing a card you can’t use. How to run a speed test covers the full panel, with history and settings.
Your speed score
The ring is the headline, and it is worth knowing exactly what it measures: Lighthouse performance, taken from your latest xSpeed Scan — not a fresh test run when the page loads. The label underneath tells you which device profile produced it and how old it is, so a stale number announces itself rather than quietly misleading you.
The bar beneath the score shows where you are against good is 90+, and the small icons toggle between the mobile and desktop figures — a scan measures both on every run, so switching costs nothing and needs no re-run.
If you’ve never run a scan, the card falls back to your Speed Test history instead. Those runs record a single strategy, and in practice that’s always mobile — so on the fallback the desktop side can legitimately be empty.
💡 This is not the same number as the scan’s own grade. Lighthouse is one check inside that scan, worth 18 of its 100 points. A site can show a strong ring here and a middling scan grade, or the reverse, without either being wrong — see How to run a full site scan.
View details takes you to the full report. When there’s no score yet for the selected device the same control reads Run a scan instead, so the button always describes what it will actually do. Last purged underneath is the age of your cache, which is the first thing to check when a change hasn’t appeared yet.
Connections

- AI connection — with Manage MCP.
Two cards cover the ways this site talks to something outside itself.
xSpeed Hub connects the site for remote control — caching driven from one place across every site you run, including from AI agents. Connect to Hub starts the sign-in; More options covers the alternatives.
AI connection reports MCP state in one line: connected and ready means an agent can purge, tune and benchmark this site. That is a broad permission, so the card exists to make the state visible from the landing page rather than buried in a panel — Manage MCP goes to the controls, including how to revoke it.
The numbers

- Metric grid — four readings of what caching is doing.
| Metric | What it means | When to worry |
|---|---|---|
| Hit ratio | Share of requests served from cache in the last 24 hours. | Below ~80% on a site with steady, repeat traffic. |
| Cached pages | How many pages currently have a saved copy, served without PHP. | Near zero while Page Cache is on. |
| Cache size | What those pages occupy on disk. | Growing far beyond your page count. |
| Avg saved | Real milliseconds saved per request, from the latest cache benchmark. | A dash is not a zero — it means no benchmark has run, or none measured a saving. |
Hit ratio is the one that answers “is this working?” — the rest describe scale. If it looks lower than your analytics suggest it should, the likely reason is that a CDN or Cloudflare is serving requests at the edge that never reach your origin to be counted.
Recommended for your site

- Recommended for your site — the ranked list.
- An action — each with a button to the panel that fixes it.
- Want a hand? — book a setup review.
A rule-based read of your current configuration and server state, surfaced as a short list rather than a report. Each entry names the problem, explains the consequence in one line, and gives you the button that leads to the fix — “The Cloudflare module is on but has no verified credentials or zone, so edge purges cannot work”, with Open Cloudflare settings beside it.
The list is read from your current state each time the page loads, so once you’ve fixed something it stops appearing. That makes it a to-do list that empties itself rather than a static checklist.
💡 This is the shallow version of two deeper tools. The Health panel’s Overview tab does the same job with severity levels and an Apply button (⭐ Pro); Scan grades the delivered site and ranks fixes by the points each recovers. Start here, go there when you want the reasoning.
Your setup

- Your setup — what’s on, by area, with Browse all features.
Four columns — Cache, Optimization, Network, Tools — each listing features with an On, Off or Pro state, the last meaning it needs a licence you don’t have. It is the fastest way to answer “did I ever turn that on?” without opening seven panels.
Browse all features expands to every group and module the list can render — the count in that link is how many. The columns above it are a curated subset, so a feature missing from them is not necessarily off.
💡 The count is of rows the expanded list can actually show, not of everything in the payload. 1.2.4 fixed it to count what renders — the old figure promised rows that could never appear, so “Browse all 46” opened a list of 26. If you remember a higher number on an older version, the lower one is the honest count.
A separate 1.2.4 fix put the On / Off pills on the same server-computed source the sidebar uses. Page Cache, Minify, Lazy Loading and MCP don’t store an
enabledkey, so they previously showed no pill at all — the features most likely to be on were the ones the card said nothing about.
Recent activity
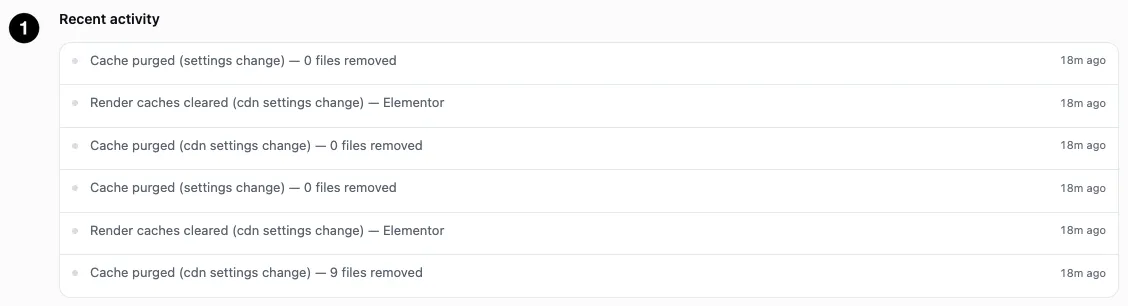
- Recent activity — the most recent changes and purges.
Two kinds of entry share the strip. Purges name their cause — a settings change, a post save, a CDN change — and how many files went. Settings changes record the old and new value and how the change was made, in the form “CDN: Enable CDN off→on (via dashboard)”. The run above happens to show purges only, because nothing had been reconfigured recently.
This is the single most useful thing on the page when something changed unexpectedly. If the hit ratio dropped this morning, the entry that explains it is usually right here. The strip shows only the newest entries; the activity log holds the last 50.
⚠️ “via dashboard” means the change came through the admin UI, which includes a browser tab left open on a settings panel — those panels save as soon as a control changes, with no confirm step. If you see a change you don’t remember making, that is the first thing to rule out.