How to run a speed test
Run a GTmetrix or PageSpeed Insights audit from the dashboard, read the six metrics beneath the score, compare two runs, and choose the provider, keys and URL the test uses.
A single performance score tells you very little. Scores bounce around between runs, and one number can’t say whether last week’s change helped. This tab runs the test, keeps every result, and lets you pick any two and compare them directly — with the settings the test uses sitting right underneath it.
Where to find it
- In your WordPress admin, click xSpeed Cache in the left menu.
- In the xSpeed Cache sidebar, open the Health & insights group.
- Click the Speed Test card, then the Speed test tab.
Shortcut: open
wp-admin/admin.php?page=xspeed#/insights/score/testdirectly. An older#/insights/score/settingslink opens this tab too.✅ This tab is part of xSpeed Cache (Free).
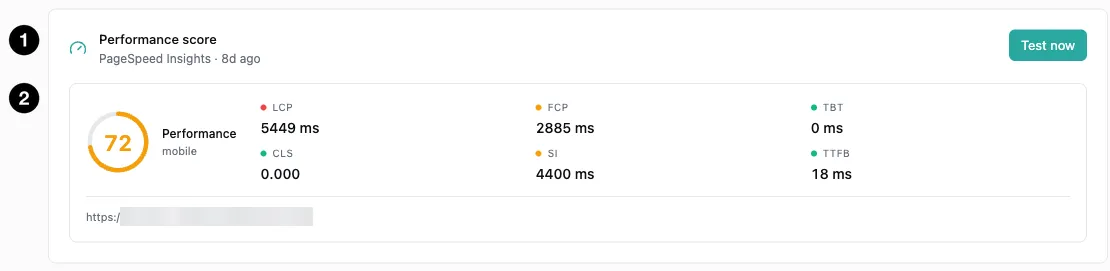
- Performance score — provider and age, with the test button.
- Metrics — the score plus the six Core Web Vitals timings.
Settings at a glance
| Setting | Default | What it does |
|---|---|---|
| Provider | PageSpeed Insights (PSI) | Which service a direct test uses. |
| PageSpeed API key | Empty | Shown under PageSpeed Insights. Labelled optional — needed in practice for direct tests. |
| GTmetrix API key | Empty | Shown under GTmetrix. Saving one runs tests on your own GTmetrix account. |
| URL to test | Empty — your home page | Which page to score. |
| Strategy | Mobile | Mobile or desktop. PageSpeed Insights only. |
How it works
There’s one test button, and what it runs depends on your setup:
| Your setup | The button reads | What runs |
|---|---|---|
| You’ve saved your own GTmetrix API key | Test now | GTmetrix, on your own GTmetrix account. |
| No GTmetrix key, and xSpeed Hub can serve this site | Test with GTmetrix | GTmetrix through xSpeed Hub — no key needed, from a monthly allowance of free tests shown beside the button. |
| xSpeed Hub can’t serve this site | Test now | Your chosen provider, directly. |
Test with GTmetrix runs through xSpeed Hub. If this site isn’t connected yet, pressing the button opens the connection dialog instead of failing, and the test runs once you’re through. When the month’s free tests are used up, the button is disabled until the allowance renews.
Pressing the button is the consent. Nothing is sent to a testing service until you press it, and there’s no switch to find and turn on first. The first press quietly turns on xSpeed’s Allow speed tests setting, which also lets features that measure on their own — an optimize run checking whether its change helped — contact the provider afterwards. That setting has no control on this panel; the button manages it.
Every run is kept, which is what makes the history and comparison useful. The card header tells you how stale the current number is — “PageSpeed Insights · 6d ago” — so you know whether you’re looking at something current or a result from before your last change.
Reading the metrics
The score is a weighted summary. The six numbers beneath it are what actually moved it, and they point at different fixes:
| Metric | What it measures | Usually fixed by |
|---|---|---|
| LCP | Largest Contentful Paint — when the main content appears | Preloading the hero, image conversion |
| FCP | First Contentful Paint — when anything appears | Critical CSS, server response time |
| TBT | Total Blocking Time — main thread blocked by scripts | Defer and delay JavaScript |
| CLS | Cumulative Layout Shift — how much the page jumps | Image dimensions |
| SI | Speed Index — how quickly content visually fills in | Broadly, everything above |
| TTFB | Time To First Byte — server response time | Page Cache, object cache |
TTFB is the one caching moves directly. A TTFB of 18 ms means your server is responding essentially instantly — page caching is working. If the score is still mediocre with a TTFB that low, the bottleneck is in the browser, not your server: render-blocking CSS, heavy JavaScript, oversized images.
That distinction saves a lot of wasted effort. A mobile score of 72 with a 5.4 s LCP and 18 ms TTFB is not a caching problem — it’s a front-end weight problem, and the fixes live in the Optimization group.
Run history and comparison
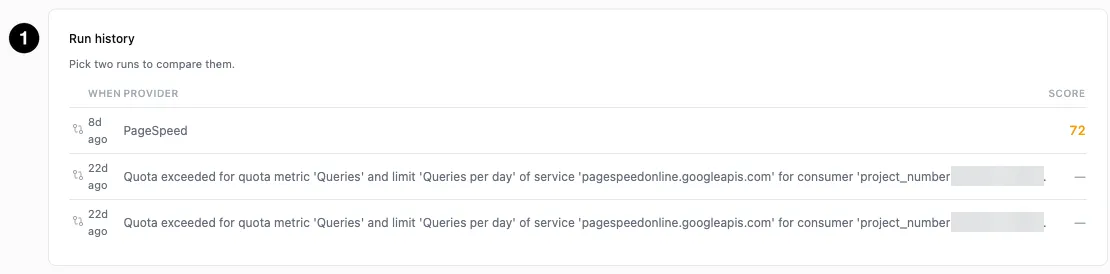
- Run history — pick two runs and compare them.
Every run is stored with its timestamp, provider, and strategy. Select two and compare them side by side.
This is the tab’s real value. A single score is noise — the same page tested twice minutes apart can differ by several points, because the test machine and network vary. Comparing two runs around a specific change is how you find out whether the change did anything.
💡 Compare like with like. A mobile run against a desktop run tells you nothing useful, since the mobile test simulates a slower device. Keep the strategy — and the provider — constant when measuring the effect of a change.
Failed runs are stored too, with their error text. So a history showing quota errors isn’t broken — it’s an accurate record that those attempts didn’t complete. If you see them on direct tests, add a PageSpeed API key in the settings below.
The settings below the test
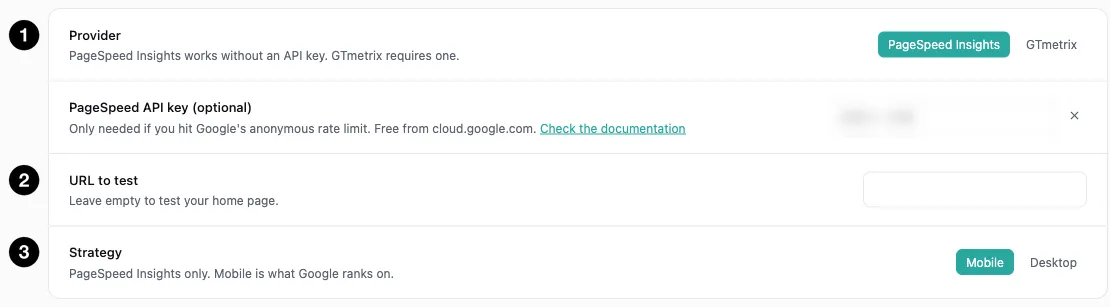
- Provider — PageSpeed Insights or GTmetrix.
- URL to test — empty means your home page.
- Strategy — mobile or desktop.
These decide what a direct test does — the Test now path. A Test with GTmetrix run through the Hub doesn’t need any of them.
PageSpeed Insights is the default provider. The panel says it works without an API key — technically true, but the shared anonymous daily quota is small enough that direct audits fail in normal use, so add a key if your tests run directly. It’s free.
Strategy defaults to Mobile, which is right: Google ranks on mobile performance, and mobile scores are typically lower because the test simulates a slower device and connection.
URL to test left empty means your home page.
Switching to GTmetrix
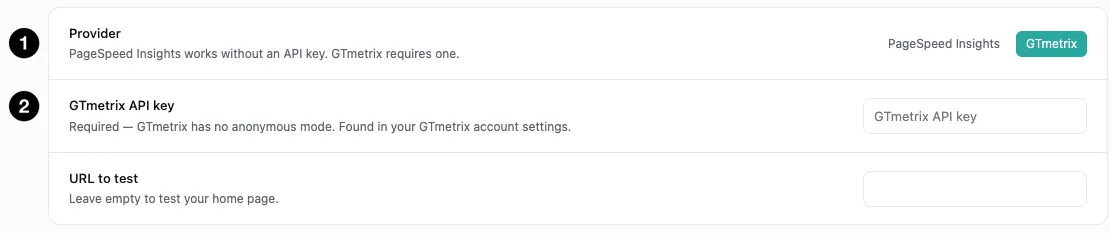
- Provider — switched to GTmetrix.
- GTmetrix API key — required for a direct GTmetrix test.
Selecting GTmetrix changes the form in two ways, and the second is easy to miss.
The key field swaps and stops being optional. The PageSpeed key field disappears, replaced by GTmetrix API key with a blunt description: “Required — GTmetrix has no anonymous mode.” Find the key in your GTmetrix account settings. Saving one also changes the button: it becomes Test now and runs on your own GTmetrix account rather than the Hub’s allowance.
The Strategy control disappears entirely. Mobile/Desktop is a PageSpeed Insights concept here — the field’s own description says “PageSpeed Insights only.” Under GTmetrix, test conditions come from your GTmetrix account settings, where the plan determines which regions, browsers and connection profiles are available.
| PageSpeed Insights | GTmetrix | |
|---|---|---|
| API key | Labelled optional, needed in practice for direct tests | Required for direct tests — no anonymous mode |
| Mobile / Desktop choice | Yes, in this panel | No — configured in your GTmetrix account |
| Cost | Free | Free tier, with paid plans for more runs |
| Score shown | Google’s Performance score | GTmetrix’s own grade and metrics |
Your keys are stored separately, so switching providers doesn’t discard the other one — switch back and your PageSpeed key is still there.
⚠️ The two providers’ numbers are not comparable. Different test locations, devices, and scoring methodology. Switching provider midway through tuning breaks your run history as a basis for comparison — a GTmetrix result next to PageSpeed results in the same list invites exactly the wrong conclusion. Pick one before you start measuring.
🔒 API keys are stored encrypted, but this panel shows a masked hint. Once a key is saved, the field displays something like
AIza••••ItrE— the first and last few characters, with the middle hidden. That’s enough to confirm which key is configured without revealing it, and the × beside it clears the key.Two consequences worth knowing. It behaves differently from the PageSpeed tab, where the field renders completely empty. And because the hint shows real characters from your key, don’t share a screenshot of this panel without covering it.