How to read the activity log
A running record of what xSpeed did and why — every purge with its cause and file count, every settings change with its old and new value.
When a site suddenly behaves differently, the useful question is what changed? This panel answers it. Every cache purge, every settings change, and every scheduled cleanup is recorded with a timestamp, a cause, and — where relevant — the old and new values.
Where to find it
- In your WordPress admin, click xSpeed Cache in the left menu.
- In the xSpeed Cache sidebar, open the Tools group.
- Click the Logs card.
Shortcut: open
wp-admin/admin.php?page=xspeed#/tools/logsdirectly.✅ This panel is part of xSpeed Cache (Free).
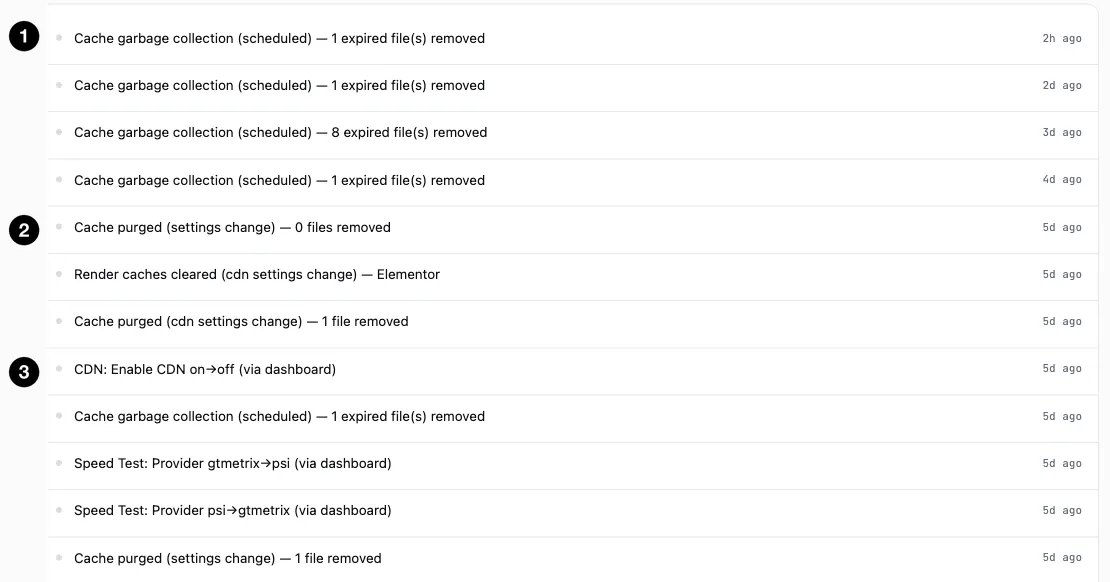
- Scheduled maintenance — garbage collection, with what it removed.
- Cache purges — each with its cause and file count.
- Settings changes — old value, new value, and where it came from.
Settings at a glance
This panel has no settings — it’s a read-only record:
| Element | What it shows |
|---|---|
| Entry list | Newest first, with a relative timestamp. |
| Severity dot | Info, success, warning, or error. |
| Message | What happened, including cause and counts. |
How it works
The log is capped at 50 entries, newest first. Entry 51 pushes the oldest out. That makes it a record of recent activity rather than an audit trail — enough to answer “what changed this week?”, not “what changed in March.”
Each entry carries a timestamp, a type, a message and a severity. The coloured dot on the left encodes severity: info for routine events, success, warn, and error for things that need attention.
What gets recorded
Three broad kinds of event, all visible in the screenshot above:
Scheduled maintenance — “Cache garbage collection (scheduled) — 1 expired file(s) removed”. Routine background cleanup of expired cache files, with the count so you can see it’s actually doing something.
Cache purges, with their cause — “Cache purged (settings change) — 1 file removed”, “Cache purged (cdn settings change)”, “Render caches cleared (cdn settings change) — Elementor”. This is the most useful part. A purge on its own tells you little; a purge annotated with why tells you whether something you did triggered it, or something else did.
Settings changes, with old and new values — “CDN: Enable CDN on→off (via dashboard)”, “Speed Test: Provider gtmetrix→psi (via dashboard)”. The old→new form and the (via dashboard) suffix together answer both what changed and how — a dashboard edit versus a WP-CLI command or an API call.
💡 This is the fastest way to answer “why did my cache clear?” Purges have many causes — publishing a post, changing a setting, a plugin update, a scheduled task. The log distinguishes them, which guesswork can’t.
Reading it when something breaks
The panel is at its most valuable immediately after an unexplained change. A practical order:
- Look for a settings change near the time the behaviour changed. The
old→newvalues tell you exactly what moved. - Check
(via dashboard). If a change wasn’t made in the dashboard, it came from WP-CLI, a REST call, or another integration — which narrows the culprit considerably on a site several people administer. - Look at purge causes. A purge annotated (settings change) right before a slowdown explains a cold cache far better than a hit-ratio graph does.
⚠️ Fifty entries is not much on a busy site. Scheduled garbage collection alone writes an entry per run. If you’re investigating something from more than a few days ago, the evidence may already have rolled off — check the log early rather than after you’ve exhausted other theories.