How to enable Page Cache
Serve saved HTML to your visitors instead of rebuilding every page — turn on xSpeed Cache's page cache, set how long pages live, and control exactly what never gets cached.
Every time someone visits your site, WordPress normally rebuilds the page from scratch — running PHP, querying the database, assembling the HTML. Page Cache does that work once, saves the finished HTML, and hands the saved copy to everyone who asks for that page next. It’s the single biggest speed win xSpeed offers, and for most sites turning it on is the only step needed.
Where to find it
- In your WordPress admin, click xSpeed Cache in the left menu.
- In the xSpeed Cache sidebar, open the Cache group.
- Click the Page Cache card.
Shortcut: open
wp-admin/admin.php?page=xspeed#/cache/cachedirectly.✅ This panel is part of xSpeed Cache (Free).

- Enable Cache — the master switch, with a one-click Purge beside it.
- Cache stats — pages cached, size on disk, last purge, and 24-hour hit ratio.
Settings at a glance
| Setting | Default | What it does |
|---|---|---|
| Enable Page Cache | Off | Master switch. Installs the drop-in and the WP_CACHE constant. |
| Cache Expiry | 168 hours (7 days) | How long a saved page stays valid. Range 1–720 hours. |
| Purge After Updates | On | Clears the cache after a plugin, theme, or core update. |
| Excluded URLs | 16 patterns | Pages never cached. |
| Excluded Cookies | WordPress + e-commerce set | Visitors carrying a matching cookie bypass the cache. |
| Bypass User Agents | Empty | User agents that always get a freshly built page. |
| Ignored Query Parameters | Analytics + ad set | Query keys stripped before the cache key is computed. |
| Separate Mobile Cache | Off | Keep mobile and desktop responses in separate buckets. |
How it works
Turning the master switch on does two things beyond flipping a setting: it installs an advanced-cache.php drop-in into wp-content/, and it adds define( 'WP_CACHE', true ) to your wp-config.php. That pair is what lets a cached page be served before WordPress fully loads — which is where the speed comes from.
Because that path edits wp-config.php, it’s deliberately kept separate from every other setting on this panel. It has its own code path and its own REST route, so a routine settings save can never touch it by accident.
Turning it off asks first — “Turn caching off? Every page will be served uncached until you turn it back on.” — because the switch is a site-wide change rather than one module’s setting.
⚠️ If another cache plugin’s file is already there, xSpeed asks before taking it over. Only one plugin can own
advanced-cache.php. When turning the switch on would replace someone else’s, a confirmation names the owner first — “Take over the page cache from WP Rocket?” — and nothing changes until you click Take over and enable. When xSpeed can’t tell whose file it is, the prompt reads “Replace the existing cache file?” instead. The one case still refused outright is a file xSpeed can’t read, because it can’t name what it would destroy.Taking over the file is not the same as switching the other plugin off. xSpeed no longer blocks you while a competing page cache is still active — which cache you want serving is your call — but two page caches running together give unpredictable results, so deactivate the other plugin’s page cache as well.
Once it’s on, xSpeed tells you what happened to every request through the x-xspeed-cache response header:
| Header value | What happened |
|---|---|
HIT (nginx) | nginx served the saved file without running PHP at all — the fastest path, once the server config snippet is in place. |
HIT (static) | Apache served the saved file through .htaccess, again without PHP. |
HIT (php) | xSpeed’s drop-in served the saved copy. Still fast — WordPress boots, but nothing is rendered or queried. |
MISS | No saved copy yet — WordPress built the page, and xSpeed saved it for next time. |
BYPASS | This request was deliberately never cached (see Exclusions). |
Only logged-out visitors are served cached pages. Anyone logged in — you, your editors, a customer with items in their cart — always gets a freshly built page. That’s why your own admin browsing never feels “stale.”
💡 Checking it yourself: load a page twice in a private window and look at the
x-xspeed-cacheheader. The first load is usuallyMISS, the second aHIT. OnlyGETrequests are served from cache, socurl -I— which sends aHEAD— reportsBYPASSevery time. Send a realGETinstead:curl -s -o /dev/null -D - https://example.com/ | grep -i x-xspeed-cache. Understanding cache HITs and MISSes covers every value.
Reading the panel
Above the settings, four cards give you the state of the cache at a glance:
| Card | What it tells you |
|---|---|
| Cached pages | How many pages currently have a saved copy. Grows as visitors arrive. |
| Cache size | Disk space those saved pages occupy. |
| Last purge | When the cache was last cleared, and what cleared it. |
| Hit ratio · 24h | Share of the last day’s requests served from cache. Aim for 80% or better. |
📊 If you’re behind an edge cache (Cloudflare and similar), the hit ratio is labelled origin and counts only requests that actually reached your server. Requests answered at the edge never arrive, so they can’t be counted — a low-looking number here doesn’t mean the cache is underperforming.
Cache impact benchmark

Loads your home page twice — once normally, once with a bypass header that forces a full WordPress render — and reports the two side by side: time to first byte, total response time, and bytes transferred. A warm-up request runs first, so the timed pair is a genuine cache hit against a genuine render rather than two misses.
Run it at least twice to build a trend. It’s the most direct answer to “is this actually doing anything?” — though it is a synthetic local measurement, not real visitor data. For that, use Visitors.
Trends
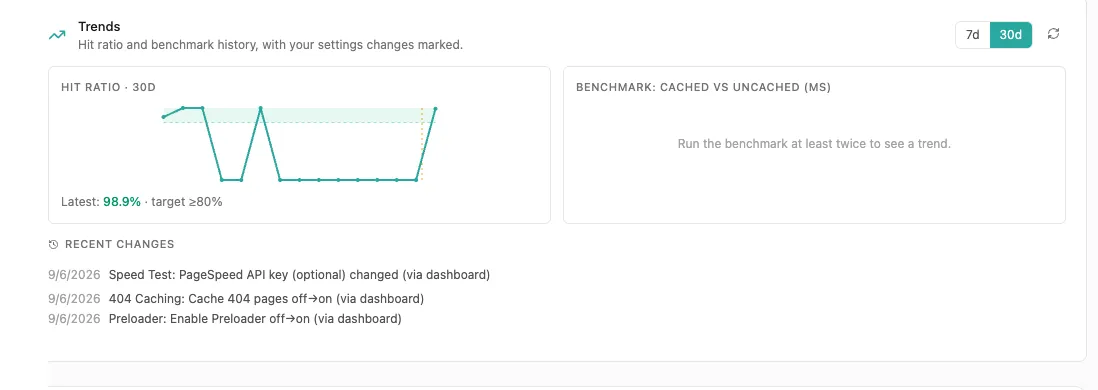
Charts your hit ratio over 7 or 30 days, with a Recent changes log underneath showing which settings you changed and when. That pairing is the useful part: if the ratio drops, the log tells you what changed around the same time.
Server config

Appears when xSpeed detects nginx or a similar server. By default the drop-in serves cached HTML through PHP, which is already fast — but pasting the provided snippet into your server config lets cached pages skip PHP entirely, which is faster still. Optional, and it needs server access.
💡 You can also get the snippet from the command line, which is easier when you’re already on the server:
wp xspeed cache nginx-configprints the unified nginx server block ready to paste into your vhost.
Cache Expiry

Cache Expiry is how many hours a saved page stays valid before xSpeed rebuilds it. Accepts 1 to 720 hours (up to 30 days); the default is 168 hours (7 days) — the screenshot above shows a site that has been set to 24 instead.
Longer isn’t automatically better — it’s a trade between freshness and work saved:
- Mostly static site (brochure, portfolio, docs): a long expiry is ideal. Pages rarely change, so rebuilding them daily is wasted effort.
- Frequently updated site (news, busy blog): a shorter expiry keeps things current — though you rarely need to rely on it, because publishing or editing a post purges the cache automatically.
If you’d rather not guess, xSpeed Pro’s Adaptive Cache reads your actual traffic and recommends a number for you.
Purging
Purging means throwing away saved pages so the next visitor gets a freshly built one. xSpeed purges automatically whenever content changes — publishing or updating a post, a new comment, changing a menu — so day to day you shouldn’t need to think about it. Those automatic purges clear the whole page cache.
Purge by hand after something xSpeed can’t observe: editing a template file over FTP, changing a setting in another plugin, or fixing something that looks stale and you want gone now. Purge beside the master switch and Purge all in the top bar both clear everything — so when only one page is wrong, clear just that page instead.
Purging one page
Correcting a typo shouldn’t cost every other page its warm cache. You can clear a single page from the places that job usually starts:
| Where | Control | Clears |
|---|---|---|
| The admin bar, while viewing a page on your site | Purge this URL | That one address. |
| The admin bar, while editing a post | Purge this post | The post and the pages that list it. |
| Posts or Pages, in a row’s hover links | Purge cache | The post and the pages that list it. |
| The edit screen’s xSpeed Cache box | Purge this post’s cache | The post and the pages that list it. |
“The pages that list it” is a fixed set, not a guess: the post itself, the blog page or its post type’s archive, the neighbouring posts whose previous and next links point at it, the author archive, any parent pages, and the homepage. Category and tag archives are left out on purpose — a post can carry dozens of terms, and clearing every one would turn a one-post fix back into the site-wide sweep you were avoiding.
Afterwards a notice reports what actually went rather than assuming it — for example “xSpeed: cleared the cache for /hello-world/ and 5 pages that list it (7 files)”, or “xSpeed: /hello-world/ was not cached, so there was nothing to clear.”
Purging from the toolbar
You don’t have to open this panel at all. xSpeed adds an xSpeed Cache menu to the WordPress admin bar, on admin screens and on the front end alike:
| Item | Clears |
|---|---|
| Settings | Nothing — opens this dashboard. |
| Purge All | Everything. Always present. |
| Purge this URL / Purge this post | One page, as described above. Shown whenever there’s a page to purge. |
| Purge Page / Static Cache | Saved HTML and the static-rewrite copies. |
| Purge CSS / JS Cache | Minified and combined asset files. Only while minification is on. |
| Purge Object Cache | The persistent object cache. Only while one is configured. |
| Purge REST Cache | Cached REST API responses. |
Pro modules can add their own entries to the same menu. It needs the manage_options capability.
💡 The top-level menu item doesn’t purge anything — it opens the settings page. It used to wipe the entire cache on click, with no confirmation, which made a stray mouse movement expensive. Purging is deliberately one level down.
Purge After Updates

- Purge After Updates — on by default.
- Separate Mobile Cache — off by default (covered below).
On by default — and you should leave it on.
When you update a plugin, theme, or WordPress core, your cached pages are suddenly out of date in a way that’s easy to miss. That saved HTML was produced by the code you just replaced. Serving it afterwards means visitors get pre-update markup — and, more visibly, links to minified CSS and JavaScript files that no longer exist on disk. The usual symptom is a site that looks broken or unstyled straight after an update, for everyone except you (you’re logged in, so you’re served fresh pages and see nothing wrong).
With this setting on, xSpeed clears the page cache automatically whenever an update lands, so the next visitor gets a page built by the new code.
Two deliberate exceptions are built in:
- Translation updates are ignored. A language pack changes no markup a cached page depends on, so purging the whole cache for one would be pure waste.
- Updates to xSpeed itself always purge, regardless of this setting. The plugin generating your cached pages changing is precisely when a stale cache is least trustworthy.
💡 When would you turn it off? Almost never. The one defensible case is a very large site where a full rebuild is genuinely expensive and you run updates during a planned maintenance window, purging manually afterwards. If that’s not you, leave it on.
Exclusions
Some pages must never be served from cache — a checkout showing someone else’s basket would be a genuine problem, not just a stale one. xSpeed ships with a comprehensive set of defaults covering WordPress internals, WooCommerce, and Easy Digital Downloads, so most sites never need to touch this.
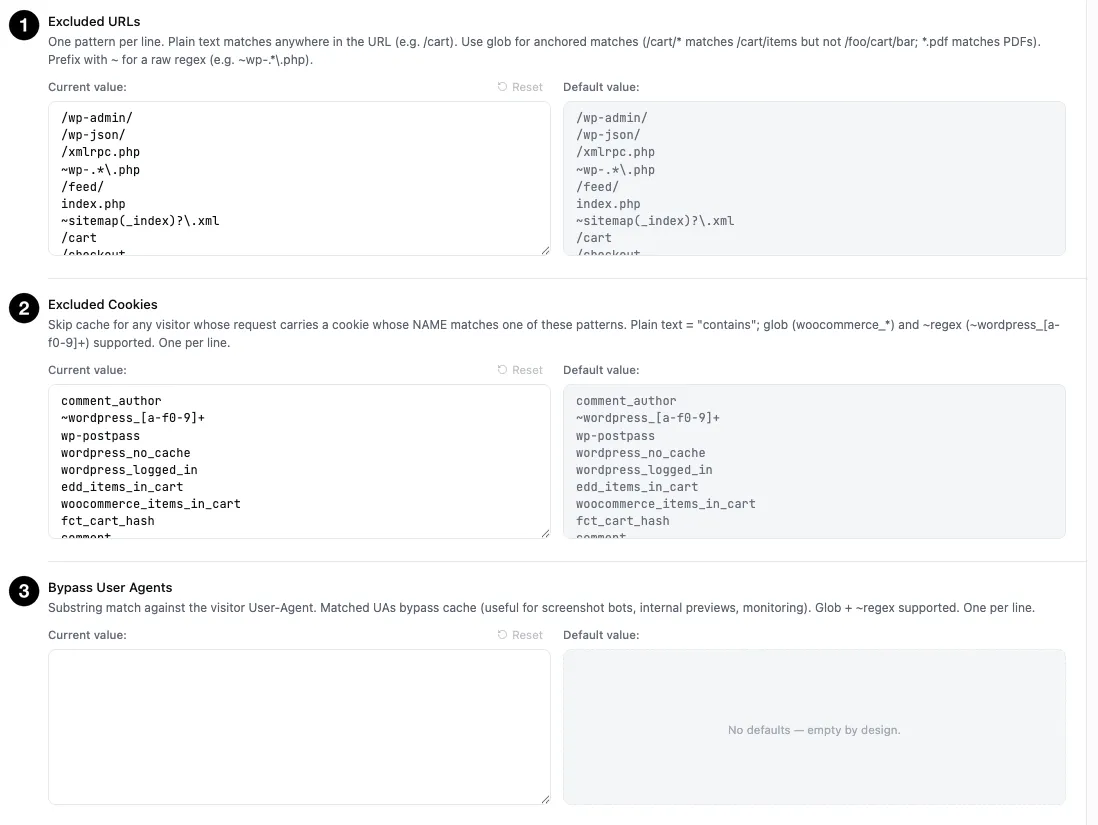
- Excluded URLs — pages never cached.
- Excluded Cookies — visitors carrying a matching cookie bypass the cache.
- Bypass User Agents — user agents that always get a freshly built page.
Each of these fields shows your Current value beside the Default value, with a Reset link to put a field back to its shipped defaults. That side-by-side is worth using — it makes it obvious what you’ve changed, and lets you undo an experiment without hunting for what the original was.
Every field takes one pattern per line, but they do not all match the same way — three different rules are in play, and the differences are deliberate.
Excluded URLs and Excluded Cookies use the glob matcher:
| Pattern style | Behaviour | Example |
|---|---|---|
| Plain text | Matches anywhere in the value (“contains”) | /cart also matches /cart/items and /foo/cart/bar |
Glob (*, ?, [abc]) | Anchored — the whole value must match | /cart/* matches /cart/items but not /foo/cart/bar |
~ prefix | Raw regular expression, unanchored | ~wp-.*\.php |
Bypass User Agents is a plain case-insensitive substring test — glob and ~regex are not interpreted here. User-agent strings vary so wildly that anchoring them helps almost nobody and surprises everybody.
Ignored Query Parameters goes the other way and matches whole names — see its own section below.
💡 Cookies match by “contains” on purpose. The shipped defaults are prefixes of hash-suffixed real cookies —
comment_authorhas to catchcomment_author_<hash>. Tightening that to an exact match would start serving shared cached pages to commenters and logged-in-adjacent visitors.
Excluded URLs — pages never cached. Defaults cover /wp-admin/, /wp-json/, /xmlrpc.php, /feed/, sitemaps, /wp-login, and the standard e-commerce pages (/cart, /checkout, /my-account, /wc-api, /edd-api).
Excluded Cookies — skip the cache for any visitor whose request carries a cookie whose name matches. This is what keeps logged-in users, commenters, and shoppers with a live cart on freshly built pages. Defaults include ~wordpress_[a-f0-9]+, wp-postpass, comment_author, and the WooCommerce / EDD cart cookies.
Bypass User Agents — substring match against the visitor’s User-Agent. Empty by default. Useful for screenshot bots, internal previews, and uptime monitors that should always see a freshly built page.
⚠️ Exclusions are a safety tool, not a tuning knob. Every pattern you add is a page that gets rebuilt on every single visit. Adding
/blogbecause one post looked stale un-caches your entire blog. Purge first; exclude only when a page genuinely must never be cached.
Ignored Query Parameters
A URL carrying ?utm_source=newsletter is, as far as your site is concerned, the same page as the plain URL — but to a naive cache it looks like a different address, so it gets saved separately. Send one campaign and you’ve got dozens of duplicate copies of one page, each rebuilt from scratch for its first visitor.
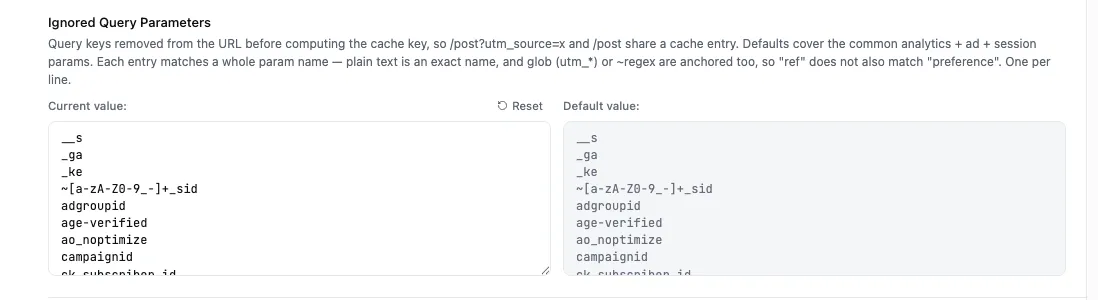
Ignored Query Parameters lists the query keys stripped from the URL before the cache key is computed, so /post?utm_source=x and /post share a single cached entry. The defaults already cover the common analytics, advertising, and session parameters — utm_*, fbclid, gclid, Facebook’s fb_action_types, and friends.
Matching here is whole-name, not substring: plain text is an exact parameter name, and glob or ~regex entries are anchored too. So an entry of ref matches the parameter ref and will not accidentally swallow preference.
Separate Mobile Cache
Off by default, and that’s right for most sites. A modern responsive theme sends the same HTML to phones and desktops — the layout differences are CSS — so splitting the cache in two would just double the work for identical output.
Turn it on only when your site genuinely serves different HTML by device: AMP, a mobile-specific theme like WPtouch or the Jetpack mobile theme, or any setup that swaps templates based on device.