Reading a PageSpeed Report in 2026: 30% of the Score Is a Metric Google Does Not Rank You On
Updated September 2026
Total Blocking Time is 30% of a PageSpeed score and is not a Core Web Vital. Interaction to Next Paint is a Core Web Vital and is 0% of that score. Both figures were read on 24 September 2026 from Chrome’s Lighthouse performance scoring documentation and Google’s Web Vitals guide.
The report most people expect is a ranked list of fixes with seconds attached. The more useful report is the one already on the page: five weighted metrics, two datasets measuring different things, and two device columns that usually disagree. This covers reading a PageSpeed Insights report on a WordPress page, in the order the numbers matter.
Quick summary: which number to read first
| If you are trying to… | Read this | Why |
|---|---|---|
| Pass Core Web Vitals in Search | The field panel, on mobile | Search uses INP, LCP and CLS from real visitors, never the score |
| Move the score itself | Total Blocking Time, then LCP and CLS | 80 of the 100 points sit in those three |
| Explain a fast server and a low score | The five weights below | Server response carries no weight of its own |
Jump to: the five metrics · field against lab · points at stake · the device that counts · which lever moves what · FAQ
The score is five metrics, and two Core Web Vitals are missing
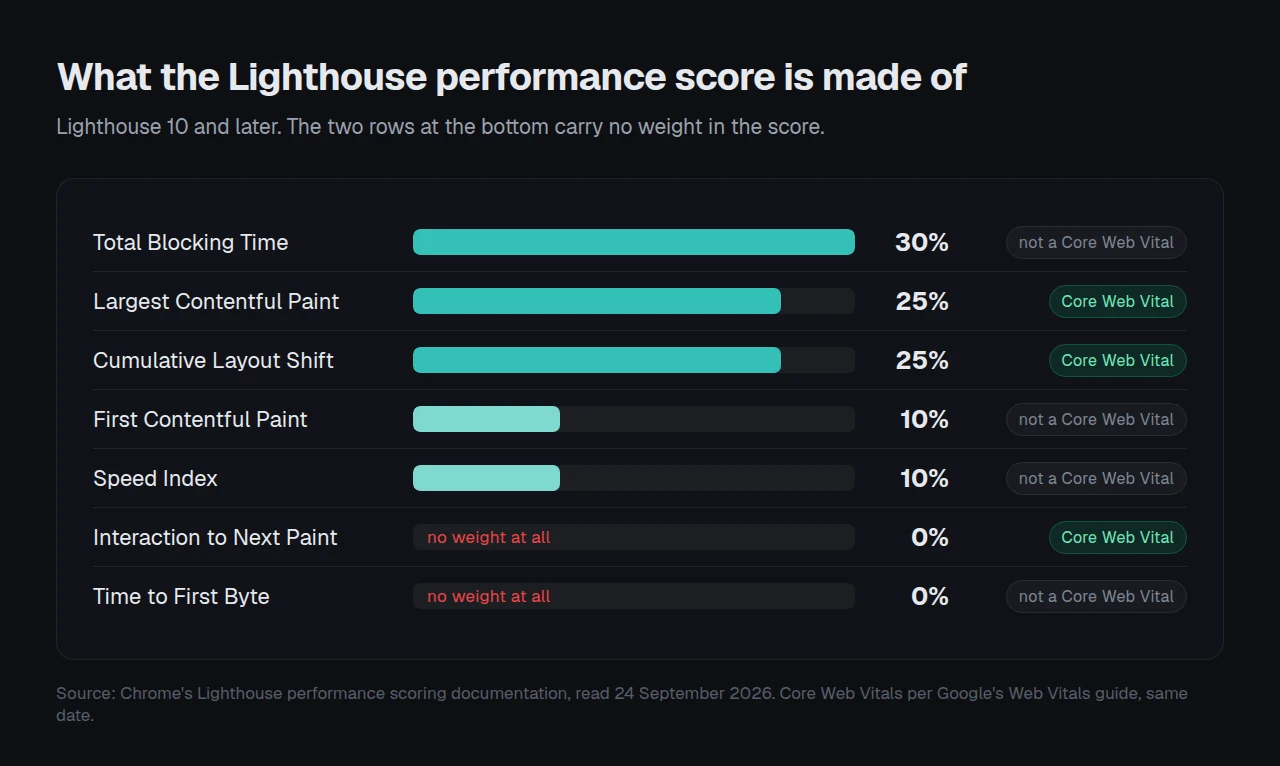
The big coloured number is a weighted average of five lab metrics and nothing else. Per Chrome’s Lighthouse scoring documentation, fetched on 24 September 2026, the weights in Lighthouse 10 and later are fixed:
| Metric | Weight in the score | A Core Web Vital? |
|---|---|---|
| Total Blocking Time | 30% | ❌ |
| Largest Contentful Paint | 25% | ✅ |
| Cumulative Layout Shift | 25% | ✅ |
| First Contentful Paint | 10% | ❌ |
| Speed Index | 10% | ❌ |
| Interaction to Next Paint | 0% | ✅ |
| Time to First Byte | 0% | ❌ |
Two rows explain most of the confusion people bring to this report.
Interaction to Next Paint is one of the three Core Web Vitals that Search assesses and contributes nothing to the Lighthouse number. Time to First Byte is the figure every caching plugin advertises, and it also contributes nothing directly. A page cache can cut server response by two thirds and leave the score where it was, which our own 958-site archive measured in September.
The same documentation is explicit that the Opportunities and Diagnostics lists do not score: “only metrics contribute to your Lighthouse Performance score, not the results of Opportunities or Diagnostics.” Those estimated savings are hints about the metrics, not points.
Field data and lab data are two reports about different people
A PageSpeed Insights page stacks two datasets that share almost no method.
The top panel is field data from the Chrome User Experience Report. According to Google’s PageSpeed Insights documentation, fetched on 24 September 2026, it covers “the previous 28-day collection period” and prints the 75th percentile of real visits for FCP, INP, LCP and CLS, plus TTFB as an experimental metric. It lags a deployment by up to four weeks, and it is what Search reads.
The panel below it is one Lighthouse run started when you pressed the button, on an emulated mid-tier phone, from a Google datacentre in North America, Europe or Asia. It is a diagnosis, not a measurement of your audience.
When the two disagree, neither is wrong. They answer different questions, four weeks apart, from different places.
- “No field data” is usually eligibility, not a fault. Chrome’s CrUX methodology, read on 24 September 2026, requires a page to be publicly discoverable and “sufficiently popular”, and excludes anything served with a status other than 200 after redirects or carrying a
noindexheader or meta tag. - The report may quietly switch to your whole site. When one page has too few samples, PageSpeed Insights falls back to origin-level data covering every page on the domain, and the number stops being about the URL you typed.
Points at Stake: rank by weight, not by estimated savings
Lighthouse hides the per-metric subscores. It does show a coloured marker beside each metric, and the weight table turns that marker into an upper bound on what the metric costs you. That is enough to rank the work.
- Write down the five lab metrics and their colour: red, amber or green.
- Multiply. A red marker means the metric is surrendering most of its weight, so a red Total Blocking Time is worth up to 30 points and a red First Contentful Paint at most 10.
- Sort by points at stake, not by the seconds printed in Opportunities.
- Stop at the first two. The curve is log-normal, and Chrome’s documentation notes that moving 99 to 100 takes roughly the improvement that moves 90 to 94.
What this cannot tell you. It bounds the loss, it does not measure it. An amber metric might be surrendering two points or twenty, and only the hidden subscore would say which. It says nothing about field data, where these weights do not exist. Use it to decide what to open first, then measure properly.
Read the device you are ranked on
Lead with a scan rather than a guess. Our own xSpeed Scan is free, needs no account, and grades the Lighthouse run on desktop and mobile in one pass, printing the five lab metrics, the CrUX field values and the server response together.
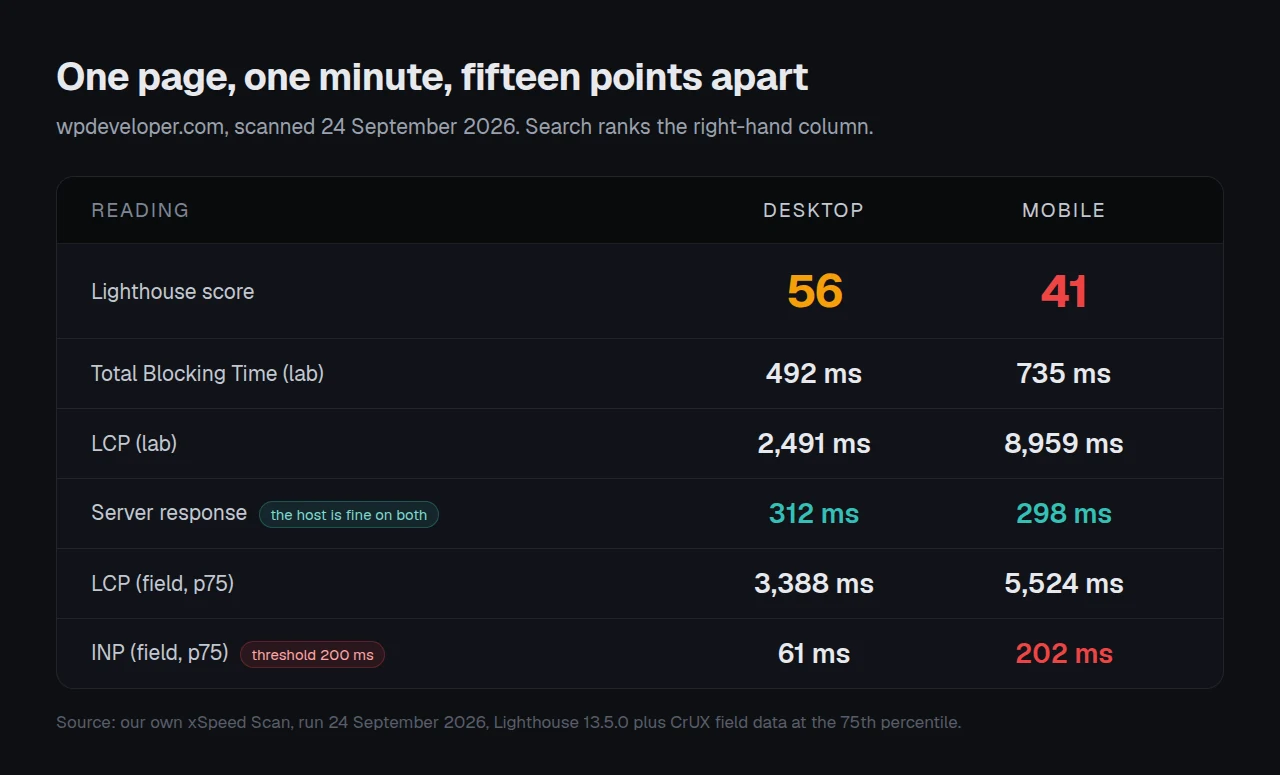
We ran it on our own company site on 24 September 2026. WPDeveloper builds xSpeed Cache, so this is our number, not a stranger’s:
| wpdeveloper.com, 24 Sep 2026 | Desktop | Mobile |
|---|---|---|
| Lighthouse score | 56 | 41 |
| Total Blocking Time (lab) | 492 ms | 735 ms |
| LCP (lab) | 2,491 ms | 8,959 ms |
| Server response | 312 ms | 298 ms |
| LCP (field, 75th percentile) | 3,388 ms | 5,524 ms |
| INP (field, 75th percentile) | 61 ms | 202 ms |
Fifteen points separate two devices on one page in one minute, and the server answered in under 320 ms on both, so none of that gap belongs to the host. The field INP of 202 ms misses the 200 ms threshold in Google’s Web Vitals guide by two milliseconds on mobile, while desktop passes it three times over.
Read the desktop column and the page looks mediocre. Search ranks the mobile one.
Which lever moves which metric
| The metric losing points | What actually moves it | What does not |
|---|---|---|
| Total Blocking Time, 30% | Removing, deferring or delaying JavaScript | Page caching, compression, a faster host |
| Largest Contentful Paint, 25% | Hero image weight, preload, render-blocking CSS | Anything below the fold |
| Cumulative Layout Shift, 25% | Width and height on images, reserved ad slots, font-display | Server speed of any kind |
| First Contentful Paint, 10% | Critical CSS, server response, fewer blocking requests | Image compression |
| Speed Index, 10% | Everything above, weighted toward the first paint | Late-loading scripts |
Page caching occupies one cell of that table and reaches the score through First Contentful Paint, which is worth ten points. That arithmetic is behind the most common complaint in WordPress performance work, covered in why caching did not fix your slow site, and it is why a page with a clean first byte can still paint late, which has four separate causes.
Caching is still worth doing. It buys headroom, protects the origin under load and makes every later fix measurable. It is simply not where 30 points live.
Running this across every site you publish
Reading one report by hand is fine. Reading forty is where people stop and the numbers go stale.
Our xSpeed Hub holds every connected site behind one connection, and xSpeed Scan is also an MCP server, documented at Scan MCP, so an assistant can pull the same desktop and mobile metrics for a fleet. Page caching and its exclusions are free and documented under Page Cache, and the module split is published on Free vs Pro. xSpeed Cache sits on the WordPress.org directory at version 1.3.5 with 6,000+ active installs, confirmed by a direct Plugin API query on 24 September 2026. The fleet workflow is on our agencies page.
None of that is required to read a report correctly. The report is free, the thresholds are published, and the weight table is the whole trick.
Run the free scan on your own site: xspeedcache.com/scan/
Common mistakes people make with this report
- 🎯 Chasing 100. Chrome’s documentation calls a perfect score “extremely challenging to achieve and not expected”. Ninety is the green band.
- 📱 Reading desktop. Search ranks the mobile experience, and the columns routinely differ by more than ten points.
- ⏱️ Retesting immediately and trusting the delta. One unchanged page scored 61 and 73 twelve minutes apart in our own testing.
- 💸 Buying a faster host to fix a script problem. Server response is not one of the five weighted metrics.
Frequently Asked Questions
My score went up but my Core Web Vitals still fail. What happened?
The score is a lab average of five metrics. The Core Web Vitals assessment is field data at the 75th percentile over 28 days and includes INP, which the score ignores. The two can diverge for a month.
I improved TTFB by 200 ms and the score did not move. Is the test broken?
No. Time to First Byte carries no weight in the score. It feeds First Contentful Paint, worth ten points, where 200 ms is a rounding difference.
Why does my report say “no field data available”?
Per Chrome’s CrUX methodology, a page must be publicly discoverable and have enough real visitors. A new page, a noindex page, or anything not returning 200 after redirects is excluded.
Which number should I report to a client?
The field panel on mobile, because that is what Search reads, with the lab score underneath as the diagnosis. Reporting only the score invites an argument about a number nobody is ranked on anyway.
My desktop score is 92 and mobile is 48. Which one is real?
Both measure different simulated devices. Ranking signals come from field data segmented by device, so mobile is the one to fix first.
Does the Opportunities list tell me what to fix first?
It tells you what Lighthouse noticed, ordered by estimated savings in seconds. The documentation states those items do not score. Rank them by which weighted metric they touch.
I ran the test three times and got three scores. Which is right?
All of them. Chrome’s documentation lists A/B tests, ad rotation, routing changes and browser extensions as sources of variability, and advises treating performance as a distribution.
Why is INP in the report if it does not count toward the score?
Because it counts toward Search. PageSpeed Insights prints the field metrics Google assesses beside a lab score that predates INP.
Can a caching plugin alone get me to 90?
On a light page, sometimes. On a typical WordPress site carrying a page builder and third-party scripts, the 30 points held by Total Blocking Time are untouched by any cache, xSpeed Cache included, and that is the honest answer.
Does the score affect my rankings directly?
No. Page experience signals use the Core Web Vitals field assessment. The score is a diagnostic sharing three metrics with it.
Conclusion: read the weights before you read the advice
| If your goal is… | Open this first | Then |
|---|---|---|
| Ranking | The mobile field panel | Fix whichever of LCP, INP or CLS is amber or red |
| A higher score | The five lab metrics and their colours | Start with Total Blocking Time |
| Proving a change | Three runs on one device | Compare medians, never single runs |
What to do this week: run the report on the page that matters most, on mobile. Write the five lab metrics and their colours in a note. Multiply each by its weight and open the largest first. Ignore the estimated savings column until you have. To skip the arithmetic, xSpeed Scan does both devices in one free pass, and xSpeed Cache is free on WordPress.org with paid tiers from $29 a year on our pricing page, carrying a 14-day money-back guarantee.
If the largest number turns out to belong to a script you did not add, you have found the real work. That is the report doing its job.