The Same Page Scored 61 and 73 Twelve Minutes Apart: How to Benchmark WordPress Caching Plugins in 2026
Updated September 2026
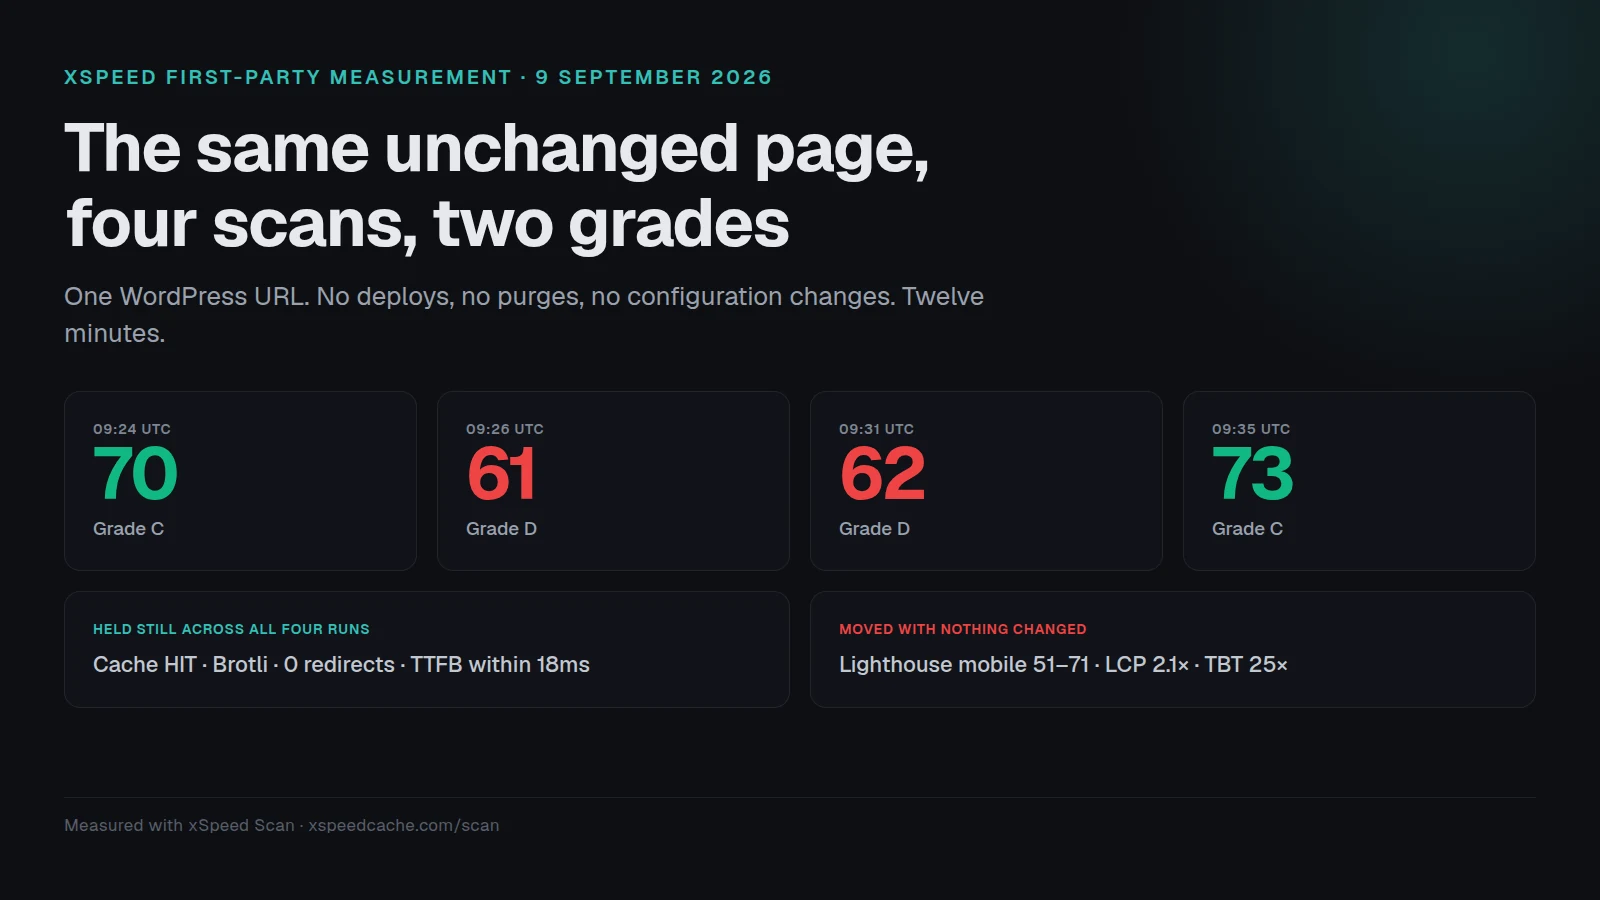
Our own speed scanner graded the same unchanged WordPress page 70/100 on 9 September 2026 at 09:24 UTC and 61/100 at 09:26 UTC, a drop from C to D in 129 seconds. Nothing was deployed between the two runs. Across four scans in twelve minutes the page returned scores of 70, 61, 62 and 73, while Google’s Lighthouse mobile score for it ranged from 51 to 71 and Total Blocking Time moved from 33ms to 825ms.
The comparison people expect from a caching article is a table of plugins with a winner at the top. The more useful comparison is between the numbers that move when you change nothing and the numbers that hold still, because only the second kind can detect a plugin. This post publishes the method, its limits, and every measurement we took.
Quick Summary: What to Measure and What to Ignore
| If you want to… | Do this | Why |
|---|---|---|
| Prove a cache is working | Read response headers and median TTFB over 10+ requests | Held steady across every run we made |
| Compare two caching plugins | Measure your noise floor first, then only report gaps larger than it | Gaps inside the floor are coin flips |
| Judge a “fastest plugin” post | Check whether it states runs per configuration | One run per plugin cannot rank anything |
| Track Core Web Vitals | Use field data over weeks, not a lab score today | Lab LCP varied 2× on an unchanged page |
| Decide what to fix | Separate delivery metrics from browser metrics | They have different noise and different causes |
The rest of this article is the protocol behind that table, the raw numbers, and the things it cannot tell you.
How We Measured, and What This Method Cannot Show
Two instruments, both first-party, both reproducible.
Instrument one: repeated HTTP timing. We requested eight production WordPress home pages 25 times each with curl, discarding three warm-up requests per site, one second apart, from a single Linux host, recording time_starttransfer for every request. All eight sites are ours: EmbedPress, SchedulePress, NotificationX, BetterDocs, Essential Blocks, Flexia, Better Payment and StoreFAQ are WPDeveloper products, and WPDeveloper is a Startise company.
Instrument two: repeated full scans. We ran xSpeed Scan, our own free speed scanner, four times against https://embedpress.com/ between 09:24 and 09:36 UTC on 9 September 2026, forcing a fresh measurement each time. Each run performs server probes plus a Google PageSpeed Insights Lighthouse 13.4.1 mobile pass. The four reports are public and permanent at xspeedcache.com/scan/r/{scanId}.
Now the limits, before any result.
| Limitation | What it means for these numbers |
|---|---|
| One page, four scans | Enough to show variance exists, not enough to estimate its true distribution |
| Eight sites, one platform | All WordPress, all ours, all on similar infrastructure |
| One prober location each | Our HTTP timing ran from one host; the scanner probes from Vilnius |
| Absolute values are path-dependent | Our two instruments disagreed by 119ms to 143ms of TTFB on the same site the same morning |
| No plugin was swapped | This measures the measuring apparatus, not any plugin’s effect |
| Observational | Nothing here establishes a cause for any individual number |
That fifth row is the important one. We did not install six caching plugins and race them. We measured what a benchmark harness reports when the thing being tested does not change, which is the number every plugin comparison needs and almost none publishes.
Four Scans of One Unchanged Page
Same URL, same site, no deploys, no cache purges, no configuration changes. Cache status was HIT on all four runs.
| Measurement | 09:24:10 | 09:26:19 | 09:31:19 | 09:35:43 | Spread |
|---|---|---|---|---|---|
| Overall score | 70 | 61 | 62 | 73 | 12 points |
| Grade | C | D | D | C | two grades |
| Lighthouse mobile | 70 | 55 | 51 | 71 | 20 points |
| Lighthouse desktop | 72 | 97 | 93 | 77 | 25 points |
| Largest Contentful Paint | 5.10s | 10.53s | 6.08s | 5.93s | 2.1× |
| First Contentful Paint | 4.2s | 5.5s | 2.9s | 2.9s | 2.6s |
| Total Blocking Time | 78ms | 228ms | 825ms | 33ms | 25× |
| Cumulative Layout Shift | 0.000 | 0.000 | 0.000 | 0.000 | none |
| Time to first byte | 319ms | 337ms | 329ms | 326ms | 18ms |
Scan IDs, in order: embedpress-com-53d3698907, embedpress-com-30473357fd, embedpress-com-5f5ca2b4be, embedpress-com-30ceb11f0b. The second of those reports is the D-grade run, still live and readable.
Two individual checks are worth naming. The Total Blocking Time check returned pass, then partial, then fail, then pass across the four runs. The minified-assets check reported a 50% audit score, then 0%, then 50%, then 50%, on a page whose assets never changed.
Which Numbers Moved and Which Held Still
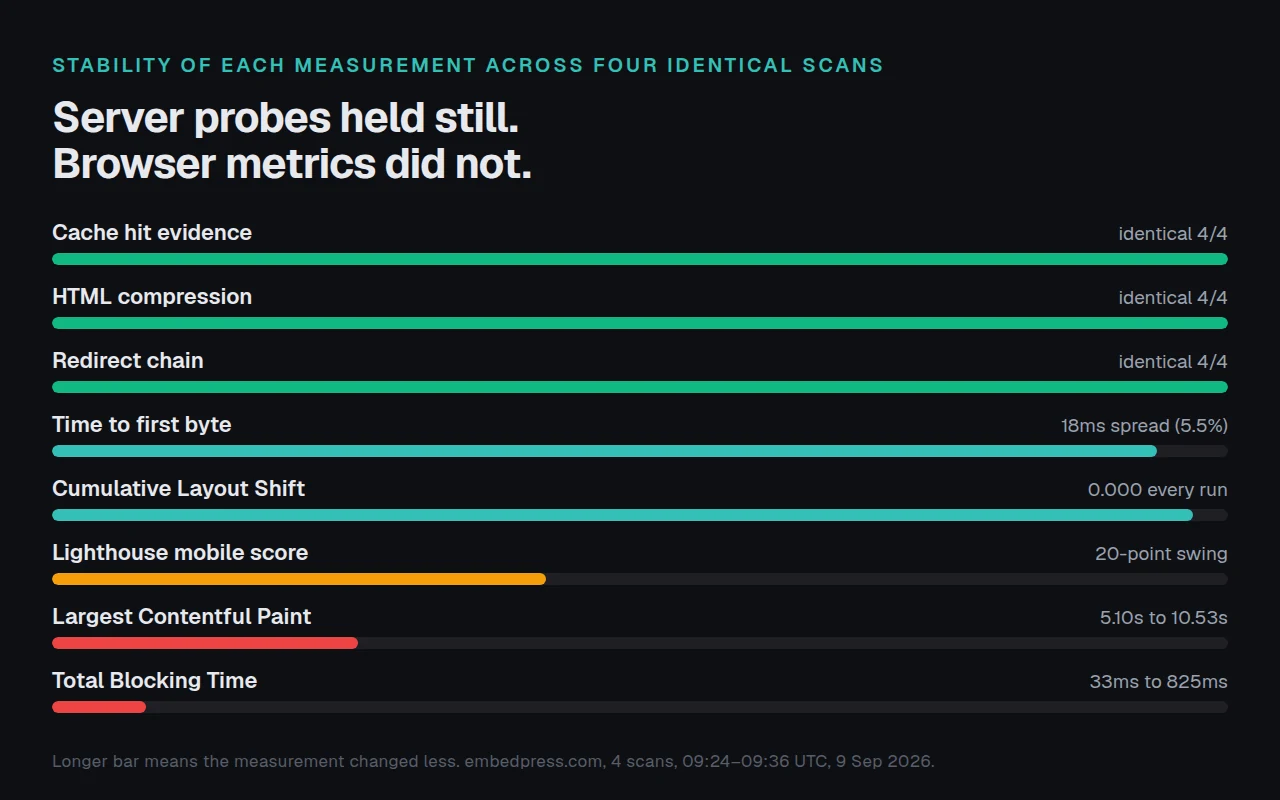
Group the four runs by where each measurement comes from and the pattern is clean.
| Dimension | What it measures | Score across 4 runs | Behaviour |
|---|---|---|---|
| Delivery | Server probes: TTFB, cache evidence, compression, redirects | 82, 82, 82, 82 | Identical every run |
| Stack | Detected platform and plugins | 100, 100, 100, 100 | Identical every run |
| Assets | Lighthouse asset audits | 71, 43, 71, 71 | One run disagreed |
| Speed | Lighthouse lab metrics | 57, 43, 41, 62 | 21-point range |
Every check in the delivery dimension returned the same verdict four times out of four: cache HIT, Content-Encoding: br, zero redirects, TTFB in a partial band. Every check derived from a headless browser moved.
This is the mechanism behind a finding we published on 8 September, when 958 scanned sites showed caching cutting median TTFB by 73% while leaving LCP unchanged. Caching acts on the delivery layer. The delivery layer is the stable, measurable one. LCP sits at the noisy end of the instrument, which makes it a poor detector of a caching change even when caching genuinely helps.
Google’s own documentation says as much. Per Chrome for Developers’ Lighthouse performance scoring reference, “even though Lighthouse can provide you a single overall Performance score, it might be more useful to think of your site performance as a distribution of scores, rather than a single number.” The same page lists traffic routing changes, device differences and background software among the causes, and notes that most of the variability is not Lighthouse’s doing.
The Noise Floor Belongs to Your Setup, Not to the Web
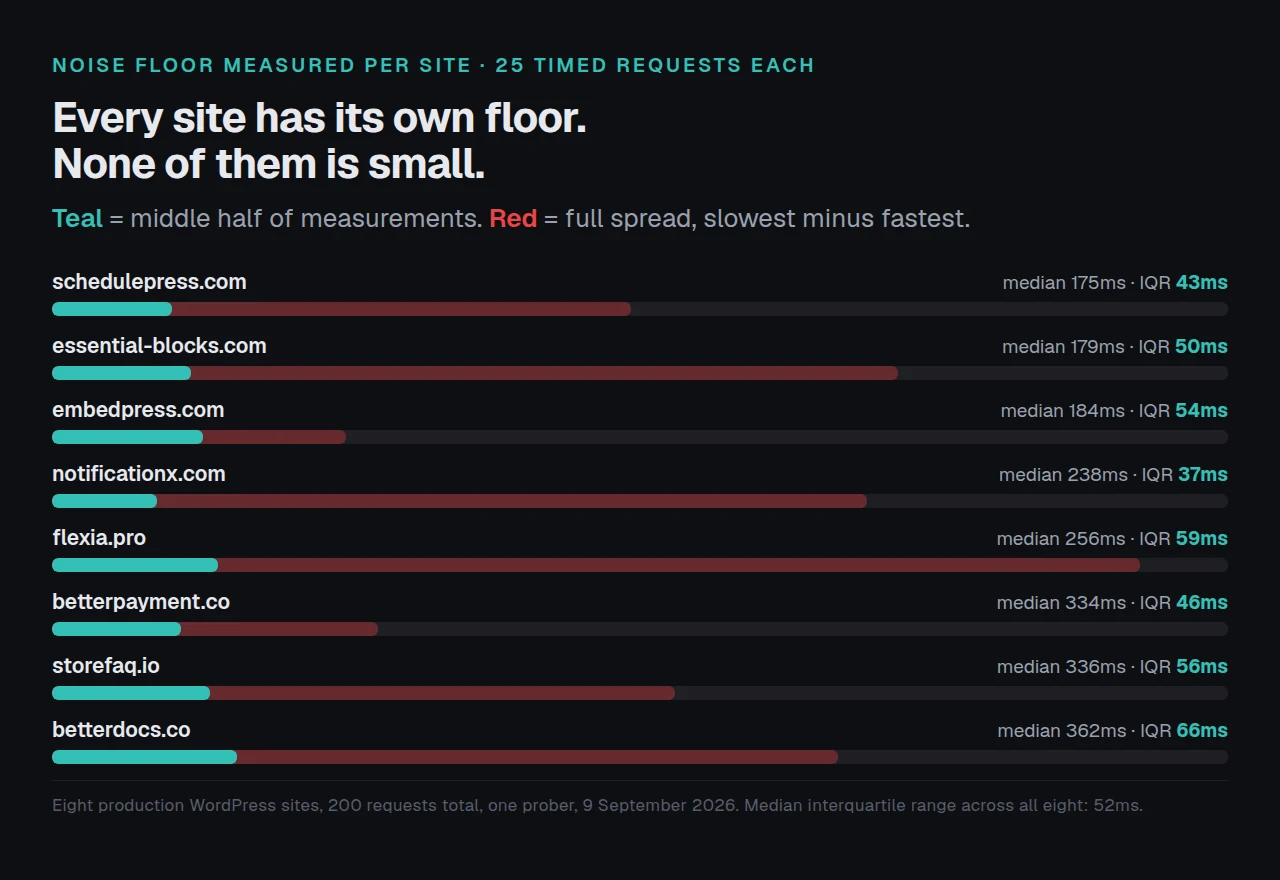
The scanner is one harness. A plain HTTP timing loop is another, and it is the one most people can run. Across eight production sites, 25 requests each, 200 measurements in total:
| Site | Median TTFB | Interquartile range | Slowest minus fastest | Range as % of median |
|---|---|---|---|---|
| schedulepress.com | 174.9ms | 43.0ms | 206.7ms | 118% |
| essential-blocks.com | 179.3ms | 49.7ms | 301.8ms | 168% |
| embedpress.com | 184.3ms | 53.8ms | 105.2ms | 57% |
| notificationx.com | 238.2ms | 37.4ms | 291.1ms | 122% |
| flexia.pro | 255.9ms | 59.3ms | 388.5ms | 152% |
| betterpayment.co | 333.7ms | 46.3ms | 116.6ms | 35% |
| storefaq.io | 335.9ms | 56.1ms | 222.7ms | 66% |
| betterdocs.co | 362.0ms | 65.8ms | 280.6ms | 78% |
The middle half of measurements spanned a median of 52ms. On the median site the slowest request took roughly twice as long as the fastest, with nothing changed in between.
The ratio does not follow the size of the number. Measured the same way on the same day, a static site came in at 16% interquartile spread relative to its median, wordpress.org at 27%, one of our WordPress sites at 34% and web.dev at 45%. A faster origin does not automatically give you a quieter measurement. Your noise floor is a property of your specific origin, your specific network path and your specific prober, which is exactly why it has to be measured rather than assumed. Part of it is a hosting property: a crowded shared origin has a wider floor than a tuned one, and no plugin can narrow it from inside PHP. That is the case for pairing a cache with a server built for it, which is why we recommend xCloud for the origin behind one. xCloud is ours, in the same way xSpeed is: both are Startise companies.
What One Run Each Actually Decides
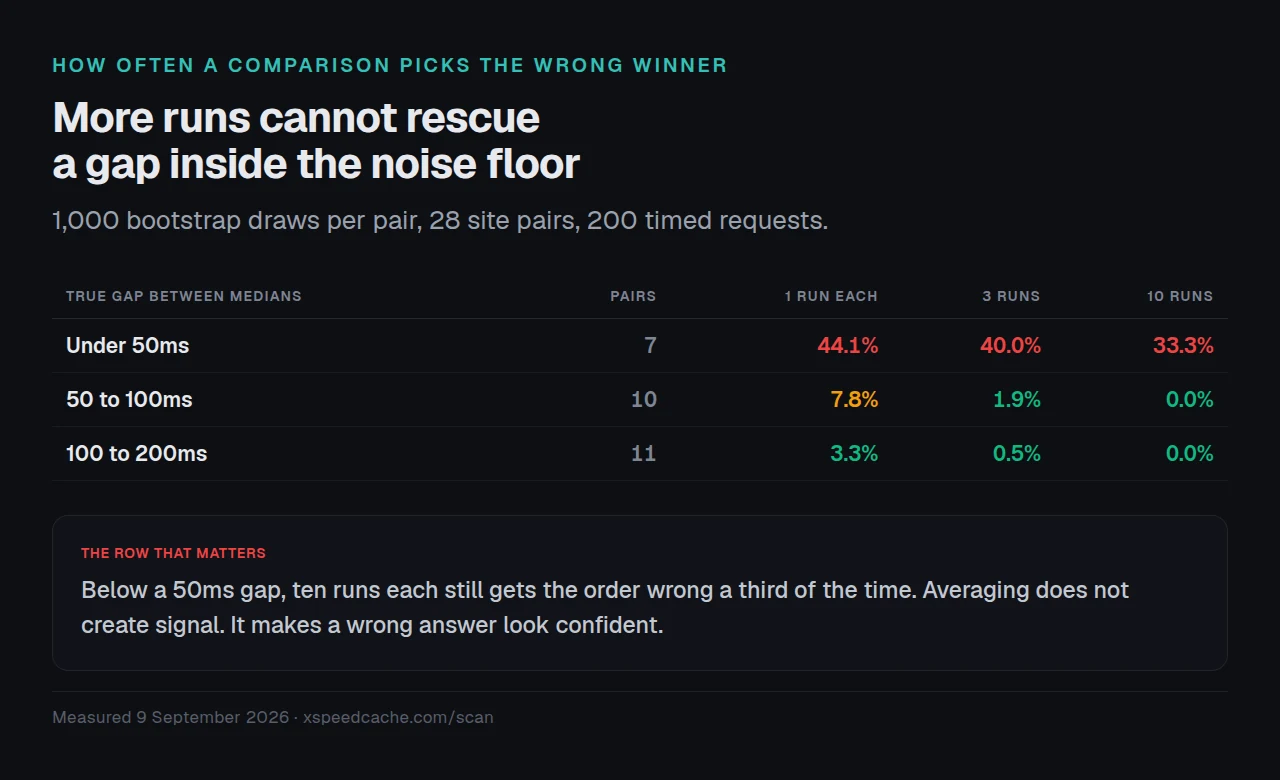
Take the 200 timings above as populations. Draw one random request from site A and one from site B, declare the faster one the winner, and compare that verdict against the ranking of their 25-run medians. Repeat 1,000 times for all 28 site pairs.
| True gap between medians | Pairs | Wrong verdict at 1 run each | At 3 runs | At 10 runs |
|---|---|---|---|---|
| Under 50ms | 7 | 44.1% | 40.0% | 33.3% |
| 50ms to 100ms | 10 | 7.8% | 1.9% | 0.0% |
| 100ms to 200ms | 11 | 3.3% | 0.5% | 0.0% |
Read the first row carefully, because it overturns the usual advice. When the real difference is smaller than the noise floor, a single run gets the order wrong 44% of the time, and ten runs each still gets it wrong a third of the time. Averaging does not rescue a comparison whose signal is smaller than its noise. It only makes the wrong answer look more confident.
The second and third rows carry the good news. Once the gap clears the floor, three runs is genuinely enough, and the third run is where most of the improvement lands.
We also asked how many runs it takes for a median to settle. To land within 25ms of the 25-run median nine times out of ten took about ten runs. To land within 10ms, twenty runs was still only getting there 73% of the time.
The Minimum Detectable Difference Protocol
Five steps. The novel part is step two, which almost no published caching comparison performs.
1. Freeze everything except the variable. One site, one host, one theme, one content set, one URL, one prober, one time window. Change the plugin and nothing else. A comparison assembled from numbers gathered on different sites is measuring the sites.
2. Measure your noise floor before you measure anything. Run the identical test at least ten times with nothing changed. Record the interquartile range and the full spread. That spread is your floor, and it is yours alone.
3. Compute your Minimum Detectable Difference and publish it. Set the MDD at the interquartile range of your own null test. Any observed gap smaller than the MDD gets reported as “no difference detected”, never as a ranking. On our harness that threshold was 52ms.
4. Pick instruments by their floor, not their fame. Rank candidate metrics by how much they moved when nothing changed. In our four scans, cache-hit evidence and compression never moved, TTFB moved 5.5%, the Lighthouse mobile score moved 20 points and Total Blocking Time moved 25×. Build the comparison on the quiet end.
5. Score seven columns, not one. A single speed number hides the cost of getting there. The seven are in the next section.
Everything in this protocol is falsifiable by anyone with curl and a free scanner. That is the point of publishing it rather than publishing a leaderboard.
The Seven Columns a Caching Comparison Should Carry
| # | Column | How to fill it | Noise level |
|---|---|---|---|
| 1 | Median TTFB on a cache hit | 10+ requests, report the median and the IQR | Low |
| 2 | Cache coverage | Share of tested URL types that returned HIT | Low |
| 3 | Page weight delta | Bytes before and after, same URL | Low |
| 4 | Lab metrics as a distribution | 5+ runs, report the range, never one number | High |
| 5 | Configuration time | A stopwatch, from install to that result | Low |
| 6 | Things that broke | Count of visual or functional regressions found | Low |
| 7 | Annual cost including your time | Licence plus column 5 at your hourly rate | Low |
Column five is the one no benchmark measures and the one that decides most real purchases. A plugin that reaches a good result in eight minutes and a plugin that reaches a marginally better one after two hours of tuning are not close, and no speed table will ever show that.
Column six matters because caching failures are rarely slow pages. They are stale prices, broken carts and logged-in users seeing someone else’s page. Our own guide to checking whether WordPress caching is actually working covers the header reads that catch those, and the migrating between cache plugins documentation covers the conflicts that cause them during a test.
Running This Across a Fleet of Client Sites
Doing this by hand on one site is an afternoon. Doing it across twenty five client sites, before and after a change, is where it stops being feasible with a stopwatch and a terminal.
That is the problem we built for. xSpeed Scan is our free scanner, it needs no account, and every report it produces is a permanent URL you can put in a client email or diff against next month; you can run it on your own site or browse every public report. It also speaks MCP, so an AI assistant can run the repeated scans for you and read back the spread rather than a single score; the scan MCP documentation has the connection string.
Two things make repeated testing practical at that scale:
- 🔁 A permanent report per run, so the spread is a record rather than a screenshot someone took once.
- 🤖 A machine-readable interface, so ten runs cost one instruction instead of ten browser tabs.
xSpeed Cache is ours too, and it is the plugin we recommend for the delivery layer this article says you should measure: static file caching that runs before PHP starts, cache hits in the 5 to 15ms range, and an import module that pulls settings across from WP Rocket, W3 Total Cache or WP Super Cache so a plugin swap during a test does not mean rebuilding your configuration by hand. The 80-capability comparison records which tier each feature ships in rather than only whether it exists. For stores, where uncacheable routes are the whole difficulty, our WooCommerce use-case page covers what should never be cached.
One number from this study does favour us and it belongs here under the same caveats as everything else: on the site we scanned, which runs xSpeed Cache, the delivery dimension scored 82 out of 100 on all four runs and every one of its checks returned an identical verdict every time. The cache did its job and reported it consistently. The same page still scored 51 on Lighthouse mobile in one run, because its JavaScript and its largest image are not a caching problem. Both facts are true and neither cancels the other.
Run the free scan on your own site: xspeedcache.com/scan/
Common Mistakes That Make a Benchmark Meaningless
- 📉 Reporting one run per plugin. At gaps under 50ms this is a coin flip, and our data says ten runs will not fix it.
- 🌍 Comparing numbers from different harnesses. Our two instruments disagreed by 119ms to 143ms of TTFB on the same site the same morning. Both were internally consistent and neither transfers.
- 🧊 Testing a cold cache against a warm one. The first request after a purge is a different experiment from the tenth.
- 📱 Quoting a mobile Lighthouse score as a plugin’s result. It moved 20 points on an unchanged page in our test.
- ⏱️ Leaving configuration time out. It is the largest hidden cost in the whole comparison.
- 🧩 Changing two things at once. A plugin swap plus a theme update measures neither.
- 📦 Testing the home page only. Archives, search results and cart pages have different cache behaviour, and server-level differences change which features even apply.
Frequently Asked Questions
I ran the same speed test twice and got different scores. Is my site broken?
Almost certainly not. We got 70, 61, 62 and 73 on an unchanged page in twelve minutes. Run it ten times and look at the range rather than the last number.
My caching plugin comparison shows a 30ms difference. Is that real?
On our harness, 30ms was inside the noise floor of 52ms, so no. Measure your own floor with ten identical runs and compare the gap against that.
Why did my Lighthouse score drop after I installed a caching plugin?
Check whether it dropped by more than the score moves on its own. Ours moved 20 points with nothing changed. Confirm the cache is working by reading response headers instead, which is the stable signal.
How many runs do I actually need?
Ten gets a median within about 25ms of a 25-run median nine times out of ten. Three is enough only when the gap you are testing is clearly larger than your noise floor.
My TTFB looks fine but my LCP is terrible. What did I do wrong?
Nothing about the cache. Those are different layers, and our 958-site study found the same split across a large sample. Look at render-blocking assets and the largest image, which web.dev’s Largest Contentful Paint reference covers.
Can I trust a “fastest caching plugin” article?
Check three things: did it state how many runs per configuration, did it publish a noise floor, and did it test one site or several. Most published roundups, including several we compete with, answer none of the three.
Which single metric is the most reliable?
Cache hit evidence in the response headers. It is binary, it does not drift, and it returned the same verdict in every run we made. In xSpeed Scan that is check D2, and it sits in the delivery dimension that scored identically four times out of four.
Does testing from a different country change the result?
Yes, and substantially. Our scanner probes from Vilnius and our timing loop ran elsewhere; they differed by 119ms to 143ms on the same site. Keep one location for the whole comparison.
Is CLS also unreliable?
Not in our test. Cumulative Layout Shift read 0.000 on all four runs. It behaved like the delivery metrics rather than like LCP.
Should I benchmark before or after warming the cache?
After, and say so. Report the warm steady state, and if you care about the cold path, measure it as a separate column rather than mixing the two.
What about plugins that only work on certain servers?
Test on the server you actually run. Some plugins disable their page cache entirely on non-matching servers, which we covered in the alternatives roundup and which will otherwise look like a plugin that does nothing.
Conclusion: Measure the Floor Before You Measure the Change
The four scans that opened this article were not a scanner malfunction. They are what a lab measurement of a real page looks like when you run it more than once, and they are why a caching comparison built on a single Lighthouse score tells you about the afternoon it was run rather than about the plugin.
| If you are… | Start here |
|---|---|
| Choosing a caching plugin | Ten runs of TTFB per configuration, then compare against your own floor |
| Auditing a client site | Delivery-layer checks first, lab metrics as a range |
| Writing a comparison | Publish your noise floor before your results table |
| Already fast on TTFB and failing LCP | The problem is assets, not the cache |
What to do this week: run ten timed requests against your own home page and write down the spread, because that number decides which of your future measurements mean anything. Read your cache headers once to confirm the cache is live. Re-run any comparison you are relying on that reported a single number per plugin. Then, if the delivery layer is where your work is, install xSpeed Cache free, import your existing settings, and measure it against the floor you just established; pricing starts at $29 a year with a 14-day money-back guarantee, and the free tier is the complete toolkit rather than a trial.
If you publish a caching benchmark, publish your noise floor with it. We will link to anyone who does.