Take the Server Out Entirely and 93% of Slow WordPress Sites Are Still Slow: Why Caching Did Not Fix Yours
Updated September 2026
On 10 September 2026 we pulled every report in our own scan archive: 1,074 scans of 1,074 distinct hostnames, run between 30 August and 10 September. Across the 413 WordPress sites in that set, the median server response was 412ms and the median Largest Contentful Paint was 6.3 seconds. The server was responsible for 5.9% of the wait. The comparison people expect is one caching plugin against another. The more useful comparison is your page against the version of itself where the server takes no time at all, because that is the ceiling a page cache is working towards. This article measures that ceiling on 1,074 sites and gives you the four-branch check that tells you which side of it you are on.
Quick summary: what your own numbers already tell you
| If you measured this | Do this next | Why |
|---|---|---|
| No cache header, TTFB above 600ms | Confirm the cache is actually running before anything else | 20.6% of WordPress sites scanned are in this state, at a median TTFB of 970ms |
| TTFB above 400ms, LCP just over 2.5s | Fix the origin: object cache, PHP version, host | Only 3.6% of sites are here, and it is the only group a faster server rescues on its own |
| TTFB under 200ms, LCP above 2.5s | Stop tuning the cache and go to the render path | 63.2% of WordPress sites are here, and their median cache ceiling is 6.61s |
| Two runs of the same test disagree | Establish a noise floor first | Covered in our benchmark protocol |
| LCP under 2.5s already | Nothing. Move to CLS and INP | 12.6% of WordPress sites scanned |
How this was measured, before any results
The dataset is our own. Every public report at https://xspeedcache.com/scan/r/{id} is a static page, and https://xspeedcache.com/scan/r/sitemap.xml lists all of them with a lastmod date. On 10 September 2026 that sitemap held 1,074 URLs, dated 30 August to 10 September, on 1,074 distinct hostnames. We fetched all of them over ten threads in about two minutes and parsed the metric tiles and per-check detail lines out of each page. The harvest method is the same one published in our 958-site Core Web Vitals study, so it is repeatable by anyone with a list of report URLs.
xSpeed Scan is ours. It is built by WPDeveloper, the same team that builds xSpeed Cache, and it is free to run on any public URL without an account. Every site in this dataset arrived because somebody chose to scan it, which is the single largest constraint on what follows.
Of the 1,074 reports, 1,042 carry both a server-probe TTFB and a Lighthouse mobile LCP. 413 are detected as WordPress. Each report contributes one URL, scanned once, at one moment.
What this study cannot tell you
Five limitations, stated before the numbers rather than after them.
- The sample is self-selected. People scan sites they suspect are slow. The median here is worse than the median WordPress site on the open web, and no reweighting can fix that from inside the dataset.
- The two numbers come from two instruments. TTFB is an unthrottled server probe from our infrastructure. LCP is a throttled mobile Lighthouse run. Subtracting one from the other is not an exact arithmetic identity, and the direction of the error matters: the throttled run’s own server time is larger than the probe’s, so subtracting the probe understates the server’s share and therefore treats caching generously. That is deliberate. Every result below gives caching the benefit of the doubt.
- A cache cannot take TTFB to zero. Our own documented cache-hit range is 5ms to 15ms, not 0ms. Removing the entire server response is a bound nobody can reach, which is why we call the result a ceiling rather than a forecast.
- One scan is one sample of a noisy instrument. We measured this directly: the same unchanged page scored 70, 61, 62 and 73 in twelve minutes. Lab LCP is the noisiest metric in the report. Population medians across 1,042 sites are stable in a way any single row is not, and no single site’s number below should be read as that site’s true value.
- One site in 413 returned a negative ceiling. Its LCP came in below its server-probe TTFB, which is arithmetically impossible within a single load and is the cross-instrument mismatch above showing up in a single row. It is counted in the lowest bucket and named here rather than dropped.
- This is observational. Nothing here establishes that caching causes or fails to cause anything. It describes where measured time sits.
The Cache Ceiling: one subtraction, and what it bounds
The framework is deliberately small enough to run on one site with two numbers you already have.
Cache ceiling = LCP minus TTFB. It is the part of your Largest Contentful Paint that remains after the server’s entire measured response is removed. A page cache works by shrinking TTFB. Whatever is left when TTFB is gone is the floor no caching plugin can go below.
Two thresholds sort the result. Google’s guidance on web.dev states that “sites should strive to have Largest Contentful Paint of 2.5 seconds or less”. So:
| Your ceiling | What it means | What caching can still do |
|---|---|---|
| Under 2.5s | A perfect cache would put you inside the threshold | Real headroom. Fix the origin. |
| Over 2.5s | A perfect cache leaves you failing anyway | Delivery only. The gap lives elsewhere. |
That is the whole framework. Its value is not sophistication, it is that it is falsifiable on one page in thirty seconds, and that it separates two problems people routinely treat as one.
The result: 93.4% of failing sites fail with the server removed
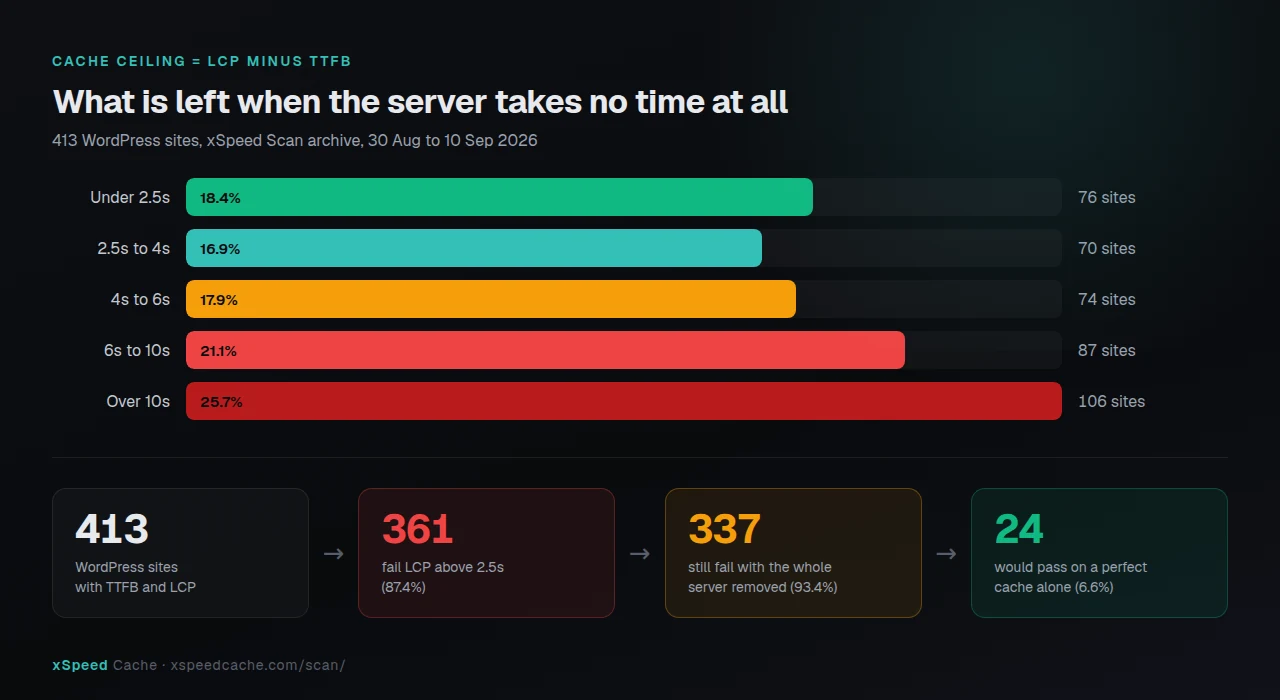
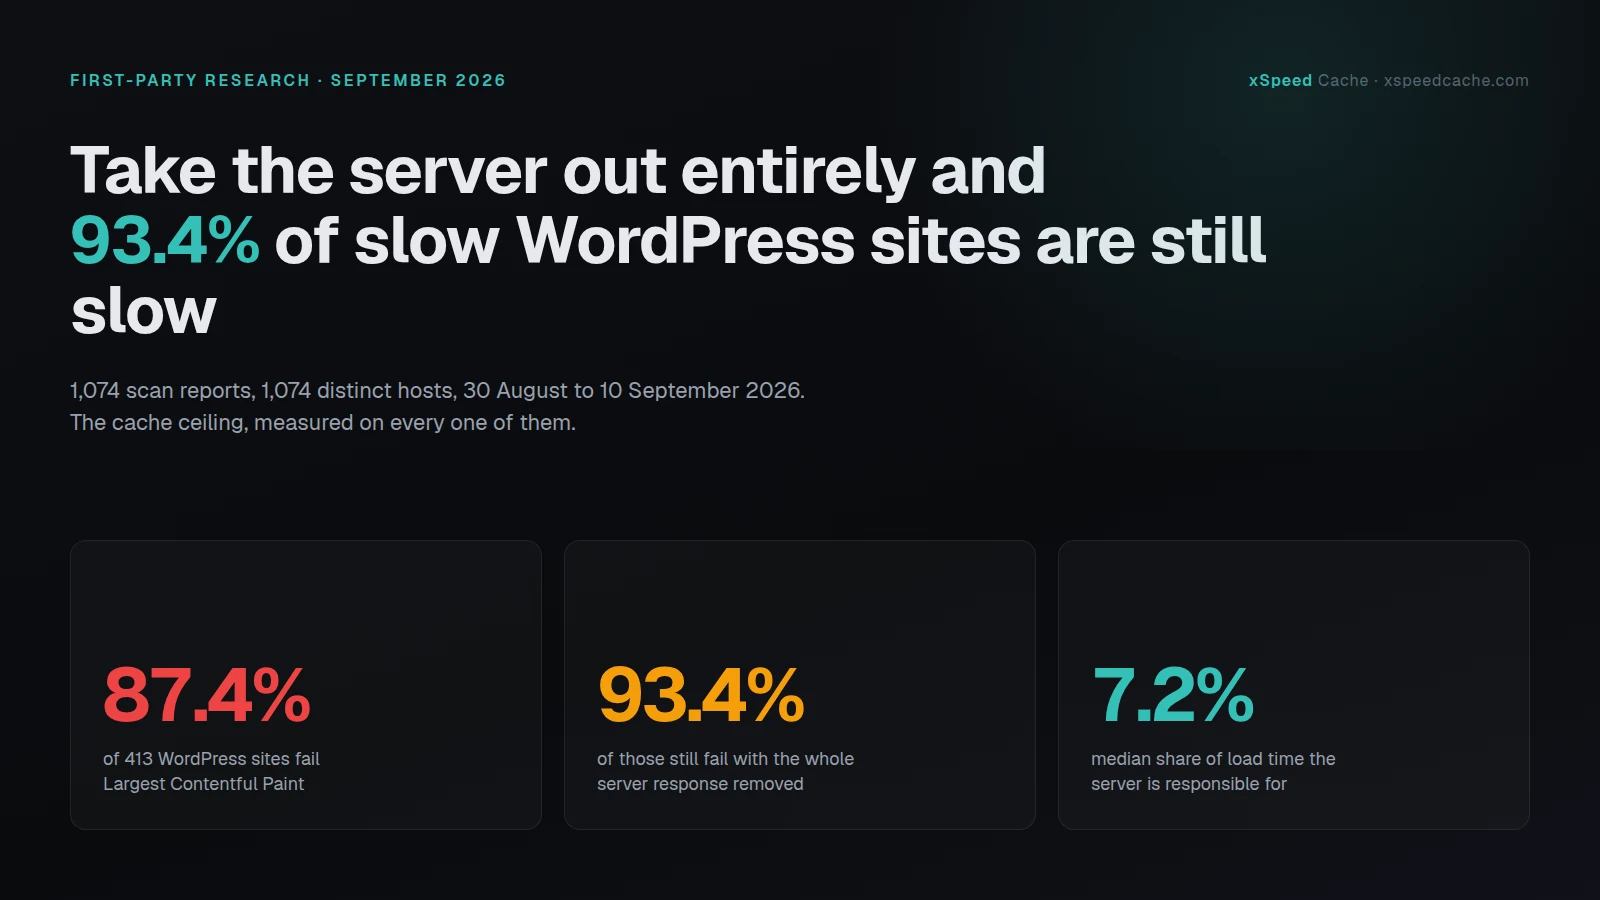
Of the 413 WordPress sites, 361 (87.4%) have an LCP above 2.5 seconds. Subtract each one’s full server response and 337 of those 361, or 93.4%, are still above 2.5 seconds. Twenty-four sites, 6.6% of the failures, would cross the threshold if their server responded instantly.
The distribution says the same thing less kindly:
| Cache ceiling | WordPress sites | Share |
|---|---|---|
| Under 2.5s | 76 | 18.4% |
| 2.5s to 4s | 70 | 16.9% |
| 4s to 6s | 74 | 17.9% |
| 6s to 10s | 87 | 21.1% |
| Over 10s | 106 | 25.7% |
| Total | 413 | 100% |
A quarter of the WordPress sites we scanned carry more than ten seconds of non-server time. For that quarter, the caching conversation is not a small optimisation away from success. It is the wrong conversation.
Where the time actually goes
Splitting LCP into three consecutive segments makes the shape obvious. For the 396 WordPress reports carrying all three metrics:
| Segment | What it covers | Median | Share of median LCP |
|---|---|---|---|
| Server | TTFB, request to first byte | 0.43s | 7.2% |
| Render to first paint | FCP minus TTFB: parsing, render-blocking CSS and JS | 2.50s | 42.1% |
| After first paint | LCP minus FCP: the largest element arriving | 3.00s | 50.7% |
Then the same question asked per site rather than on medians. For each WordPress site, which of the three segments is its own largest?
- 🟥 After first paint: 201 sites, 50.8%. The page painted and the hero image, heading or banner took its time arriving.
- 🟧 Render to first paint: 180 sites, 45.5%. Nothing was on screen yet. Render-blocking assets own this segment.
- 🟦 Server: 15 sites, 3.8%. The only group where the server is the biggest single block of the wait.
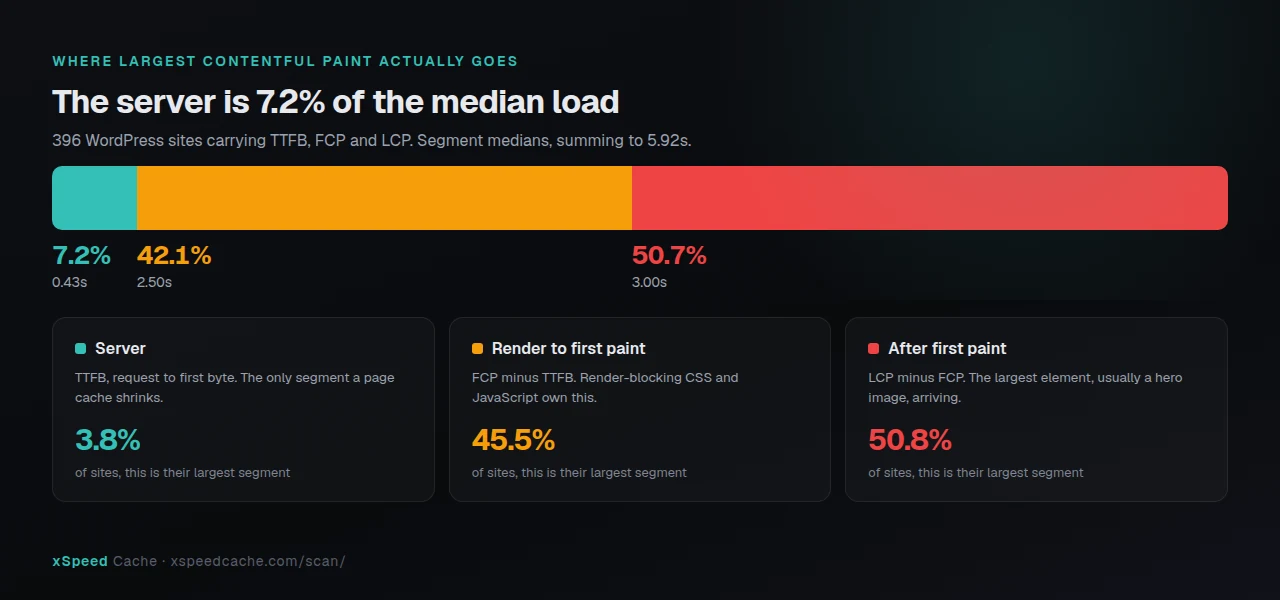
One in twenty-six sites has a server-dominated load. That is the population a page cache is built for, and it is small.
The four states, and how to tell which one you are in
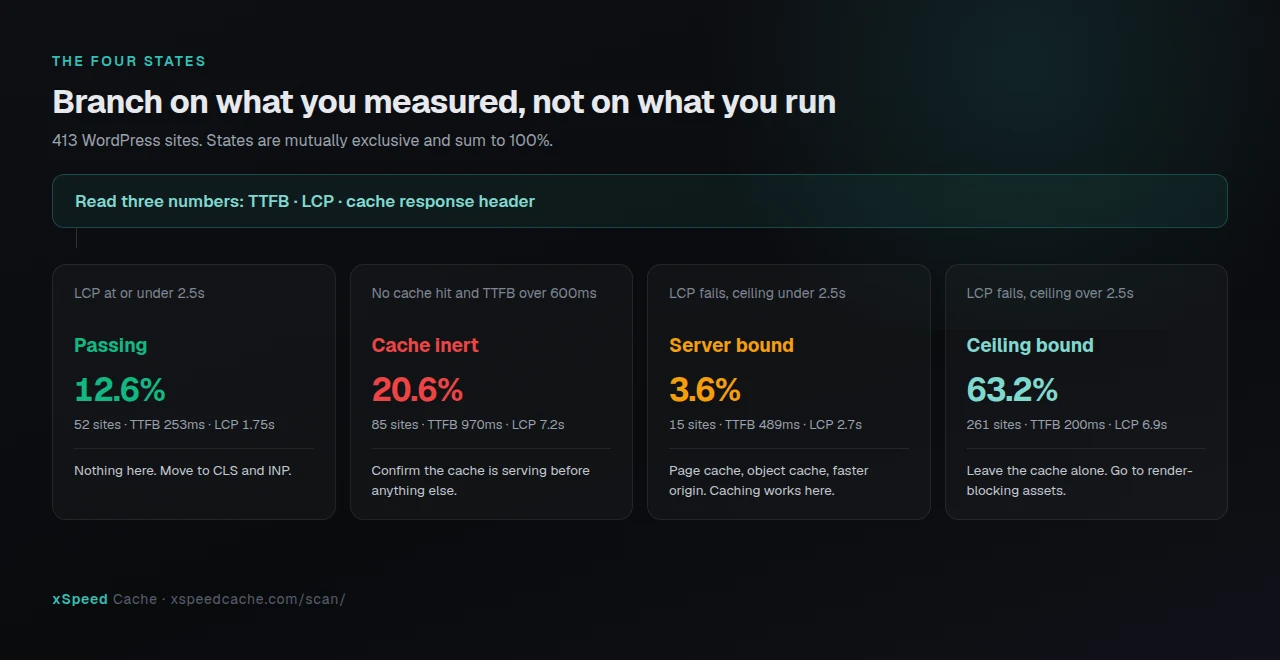
The decision tree branches on what you measured, not on what you run. Each state below is mutually exclusive and carries its measured share of the 413 WordPress sites.
| State | The test | WordPress sites | Median TTFB | Median LCP |
|---|---|---|---|---|
| Passing | LCP at or under 2.5s | 52 (12.6%) | 253ms | 1.75s |
| Cache inert | No cache hit and TTFB over 600ms | 85 (20.6%) | 970ms | 7.2s |
| Server bound | LCP fails, ceiling passes | 15 (3.6%) | 489ms | 2.7s |
| Ceiling bound | LCP fails, ceiling fails | 261 (63.2%) | 200ms | 6.9s |
State: the cache is not running
The single most common failure is not a subtle one. Eighty-five WordPress sites, one in five, showed no cache hit and a median TTFB of 970 milliseconds. The plugin may be installed, activated and configured. It may also be excluded by a cookie rule, disabled on that URL, shadowed by a second plugin, or in LiteSpeed Cache’s case switched off entirely because the site does not run a LiteSpeed server, which we documented in LiteSpeed Cache on Nginx or Apache.
Before anything else, confirm the cache is serving. Our guide to checking whether WordPress caching is actually working covers which response headers prove a hit and which six of the fourteen prove nothing. If the header is there and the page is still stale, the problem is a different cache in the chain, and that has its own guide.
State: server bound, and genuinely rescued by caching
Fifteen sites, 3.6%. Median TTFB 489ms, median LCP 2.7s, median ceiling 2.27s. These sites are close to the threshold and their server is the reason they miss it. A working page cache moves them across. So does an object cache for the queries behind an uncached route, which our Redis and Memcached documentation covers, and so does a faster origin.
This is the group every caching case study is written about. It is 3.6% of what we scanned.
State: ceiling bound, where most sites live
Two hundred and sixty-one sites, 63.2%, with a median TTFB of 200 milliseconds and a median LCP of 6.9 seconds. Their servers are fine. Their delivery layer is often excellent. The wait is downstream.
Profiling the WordPress sites with a TTFB at or under 200ms that still fail LCP sharpens it further:
| Measure | Value | Reading |
|---|---|---|
| Sites | 132 | Fast origin, failing page |
| Median delivery score | 100 / 100 | Perfect on the layer caching owns |
| Median asset score | 64 / 100 | The actual problem |
| Median page weight | 1.85 MB | Above the 1.5 MB budget in our rubric |
| Cache hit rate | 78.8% | Caching is working |
| No CDN detected | 65.2% | The remaining delivery lever |
A median delivery score of 100 next to a median asset score of 64 is the article in one row. Caching did its job. The job it did was not the one that decides LCP.
Both directions of our own number
Our scanner detects which caching plugin a site runs, and 116 of the 413 WordPress sites were running xSpeed Cache at scan time. Two things are true about that group and both belong here.
The flattering one: 74.1% of them served the scanned page from cache, against 47.5% of the WordPress sites not running it. Their median delivery score was 82 against 68, and their median TTFB was 343ms against 435ms.
The unflattering one, from the same rows: their median LCP was 7.15 seconds, worse than the 6.3-second WordPress median, and 93.1% of them failed LCP. Part of that is the thesis of this article, and part of it is selection: people install a caching plugin because the site is already slow, so the plugin’s user base is skewed towards heavy sites by construction. This dataset cannot separate those two effects, and we are not going to pretend it can. We publish the number that flatters us and the number that does not, under the same caveat.
Running this check across twenty client sites
One site is two numbers and a subtraction. Twenty sites is a spreadsheet nobody updates.
The ceiling only needs TTFB and LCP, and both come out of a single scan, so the fleet version is a loop rather than a project. xSpeed Scan is free, needs no account, and returns a permanent report URL you can re-read later. For agencies running this monthly, xSpeed Hub holds every site under one connection so an AI assistant can pull the numbers for all of them in one pass, and xSpeed Cache exposes the same data through its MCP server on the free tier.
Run the free scan on your own site and read the TTFB and LCP tiles: xspeedcache.com/scan/
Two habits that keep a fleet check honest
- 📊 Record the ceiling, not the score. The score moves with Lighthouse noise. The ceiling moves when the page changes.
- 🔁 Re-scan before acting on any single number. A ceiling computed from one unlucky run is a ceiling for a run rather than for a site.
Common mistakes this data makes visible
- ⚠️ Reading a Lighthouse score as a plugin’s report card. The delivery dimension scored identically across four consecutive runs of one unchanged page while the speed dimension moved 21 points. Attribute movement to the layer that moved.
- 🧱 Adding a second caching plugin. Two page caches on one site is the classic conflict, and it does not add up. If the ceiling is 6.6 seconds, a second cache changes the 0.2 seconds you already had.
- 🌍 Reaching for a CDN as the first fix on a fast origin. 65.2% of the fast-origin failures had no CDN, so it is a real lever. It is a delivery lever, and delivery is not where their time is.
- 📦 Treating page weight as a vanity metric. The fast-origin failures carry a median 1.85 MB. The largest contentful element is usually inside that payload.
- 🔒 Testing while logged in. Page caches skip logged-in sessions by design, and WooCommerce carts and checkout are never cached, which is its own optimisation problem for WooCommerce stores.
Frequently asked questions
I installed a caching plugin and my PageSpeed score did not change. Is it broken?
Check the cache header first, because one in five WordPress sites we scanned had no cache hit at all. If the header shows a hit, the plugin is working and your ceiling is the thing to measure next. In this dataset, 93.4% of failing sites fail with the entire server response removed.
My TTFB is 90ms and my LCP is still 7 seconds. What is going on?
You are in the largest group. Median TTFB for the ceiling-bound sites was 200ms and median LCP was 6.9 seconds. Split LCP into first paint and the element after it: 42.1% of the median load sits before first paint, which is render-blocking CSS and JavaScript, and 50.7% sits after it, which is usually the hero image.
I bought a faster host and nothing improved. Was that wasted money?
Not necessarily, but it was aimed at 7.2% of the median load. A faster origin is the right fix for the 3.6% of sites that are server bound, and it improves everything a cache miss touches. If your ceiling was already above 2.5 seconds, the host was never going to move LCP past the threshold on its own.
Two scans of my site gave completely different numbers. Which one do I use?
Neither, until you know your noise floor. We measured the same unchanged page at 70, 61, 62 and 73 in twelve minutes. Our benchmarking protocol explains how to establish a minimum detectable difference before comparing anything.
Is the cache ceiling a real metric or something you invented?
We invented the name and the subtraction. The two inputs are standard: TTFB and LCP, both defined by Google. The framework’s only claim is that the difference bounds what a page cache can do, and its stated limitation is that the two numbers come from different instruments, which makes the bound generous rather than tight.
My host says the page is cached at the edge. Does that change the ceiling?
It changes TTFB, which is the part the ceiling subtracts, so the ceiling itself does not move. Edge caching is the strongest available fix for the server segment, and it is what check S2 in the xSpeed rubric grades. It does not touch render-blocking assets or the size of your hero image.
Should I remove my caching plugin if my ceiling is high?
No. Caching is doing real work on the layer it owns, and the sites in our data running a cache had a median TTFB of 186ms against 603ms for those without. A high ceiling means you should stop expecting more from that layer, not that you should give the layer up. If cost is the reason you are asking, xSpeed Cache’s 21 free modules include page caching on any server, so there is no version of this where removing caching saves money.
Does object caching change the ceiling?
Usually not directly. Object caching reduces database work, which shows up in TTFB, which the ceiling subtracts. It matters most on uncacheable routes such as carts, search and logged-in pages, where no page cache is running at all. The setup details are in our object cache documentation.
I run WooCommerce and my product pages are fast but checkout is slow. Is that a caching failure?
No, it is caching working as designed. Carts, checkout and logged-in sessions are never page cached by any well-behaved plugin, so those routes are pure origin time. Judge them on TTFB and database work, not on cache hit rate.
Can I compute the ceiling without your scanner?
Yes. Take TTFB from any server probe, including curl -w '%{time_starttransfer}', and LCP from any Lighthouse run, including the one inside Chrome DevTools. Subtract. The only reason to use our report is that both numbers arrive together from one run on one page.
My ceiling is 1.9 seconds. What should I do first?
You are in the 18.4% with genuine headroom. Confirm the cache is serving, then work on the origin: object caching, PHP version, and the host itself. This is the group where caching and hosting changes move LCP across the threshold.
How often should I recompute this?
Whenever the page changes materially, and no more often than that. The ceiling is a property of the page’s render path, so it moves when a theme, hero image or script bundle changes, not week to week. Population-level re-runs of this study are worth doing quarterly.
Conclusion: measure the ceiling before you buy the fix
The uncomfortable version of this result is that most people asking why caching did not fix their site are asking a well-formed question with an unwelcome answer. It did fix something. It fixed the 7.2% of the load that belongs to the server, and the remaining 92.8% was never in its jurisdiction.
| Your goal | Do this | Why |
|---|---|---|
| Find out if caching is even running | Check the cache response header | 20.6% of WordPress sites scanned showed no hit |
| Decide whether more caching helps | Compute LCP minus TTFB | Under 2.5s means headroom, over means a different problem |
| Fix a ceiling-bound page | Render-blocking assets, then the largest element | 92.8% of the median load sits there |
| Fix a server-bound page | Page cache, object cache, faster origin | The 3.6% caching was built for |
| Run it across a fleet | One scan per site, record the ceiling | The score is noisy, the ceiling is not |
What to do this week:
- Scan one slow page and write down two numbers: TTFB and LCP.
- Subtract. If the result is above 2.5 seconds, close the caching settings screen.
- Open the page in Chrome DevTools and identify the largest contentful element by name.
- If TTFB is above 600ms with no cache header, fix that first, because nothing downstream is measurable until it is stable.
- If the origin is the constraint, xCloud is our hosting recommendation, and it is ours: xCloud and WPDeveloper are both Startise companies. If the cache is the constraint, xSpeed Cache is free with 21 modules and no trial clock, and Pro starts at $29 a year with a 14-day money-back guarantee. Free versus Pro sets out which is which.
If you run this on your own site and land somewhere the four states do not describe, we want the report URL. The archive behind this article grows every day, and the next version of this study will be a different 1,074 sites.