958 Sites Scanned in 2026: Caching Cut TTFB by 73% and Left LCP Untouched
Updated September 2026
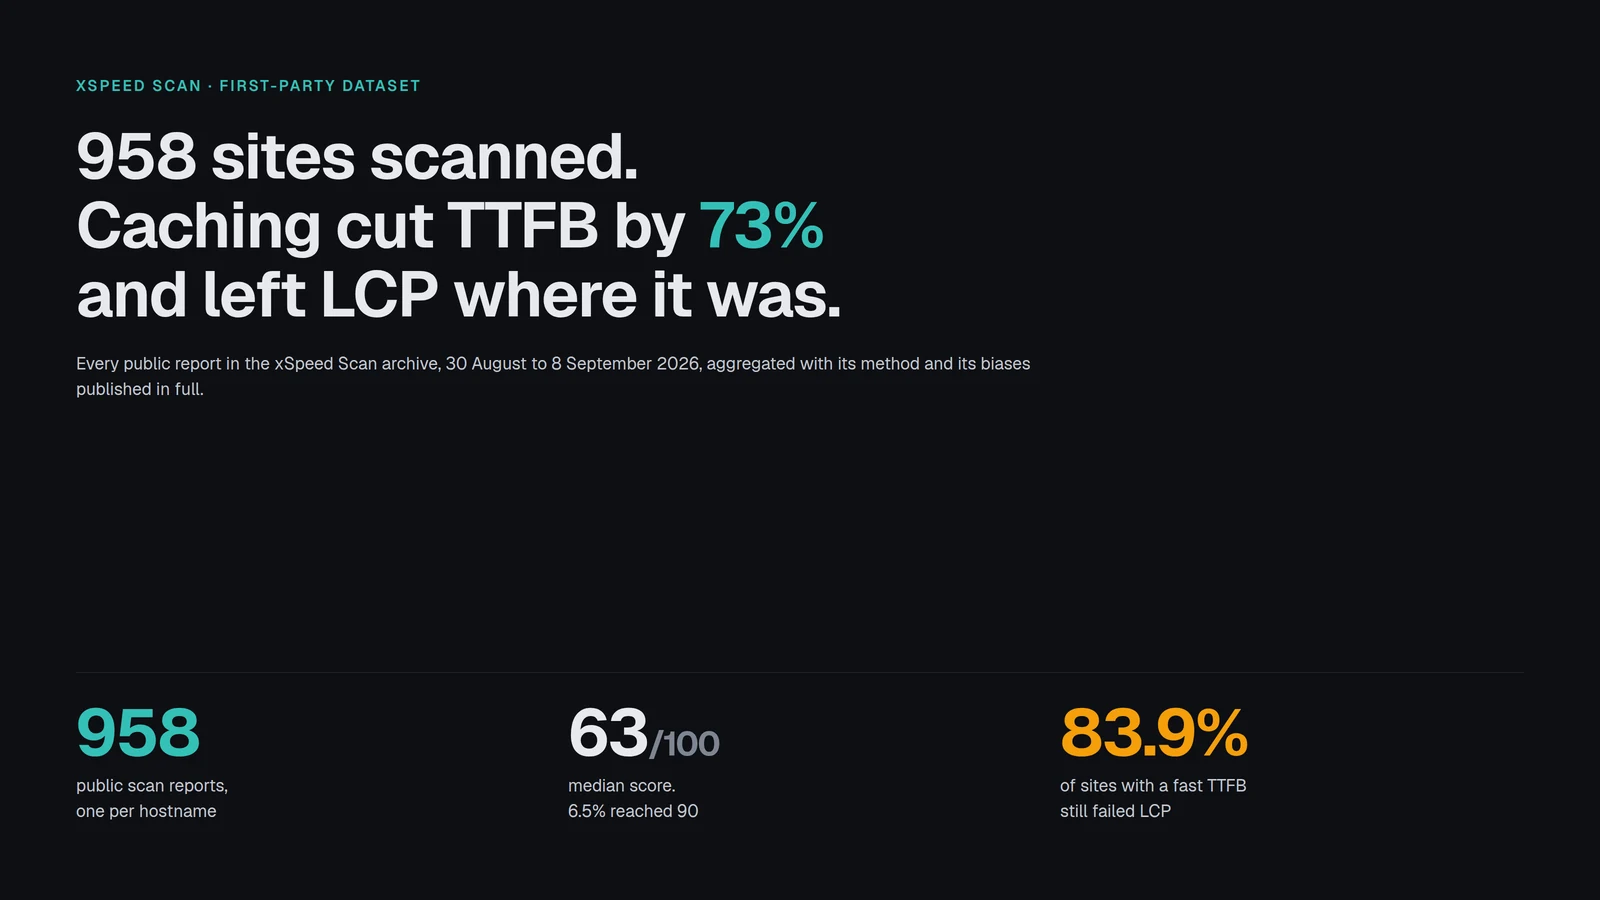
Between 30 August and 8 September 2026, our own scanner recorded 958 public website reports at xSpeed Scan. The median score was 63 out of 100. Google’s own guidance, per web.dev’s Largest Contentful Paint reference, is that a page should reach LCP within 2.5 seconds. In this dataset 61.8% of sites failed that outright.
We build a caching plugin, so the study you would expect from us is a leaderboard with our name at the top. We are not publishing that, because our own data does not support it. What the data does support is a comparison between what caching measurably fixes and what people buy it to fix, and across 958 real scans those turned out to be two different things.
This is an aggregate of our own scan data, homepage only, lab data only. Every scan in it is public and permanently linked, so any number below can be traced back to the report it came from. The method and its biases are published before the results, not after.
Quick Summary / TL;DR
| If you want to… | Do this | Why |
|---|---|---|
| Know whether caching is your problem | Read TTFB and LCP together, not the score | 83.9% of sites with a TTFB at or under 200ms still failed LCP |
| Fix a slow server response | Add a cache layer or a CDN | Sites served from cache had a median TTFB of 121ms against 442ms with no cache evidence |
| Fix a slow LCP | Look at the front end, not the cache | Median LCP was 5.35s for cached sites and 5.05s for uncached ones |
| Check one specific site | Run the free scan and read check S2 and check P1 | Both are in the report, side by side |
| Reproduce this study | Follow the method in the next section | Every scan behind it is public |
The one-line finding: caching cut median server response time by 73% across this sample and left the metric Google actually grades roughly where it was.
If your TTFB is already fast: stop buying cache layers and start measuring render-blocking assets. If your TTFB is slow: a cache layer, then an edge network. Both are cheap and both worked here. If you have no idea: the quadrant table below sorts you into one of four states in about thirty seconds.
How this dataset was built, and five reasons to distrust it
Every scan anyone runs through xSpeed Scan gets a permanent public report, and we keep all of them. We did not curate that list for this study. That is the only reason a study like this can be checked rather than believed, and it is why we can publish it from our own data while anyone working from a private database cannot.
The method, in five steps. Anyone can repeat it.
- Take every public report in our scan archive. On 8 September 2026 that was 958 reports, dated between 30 August and 8 September 2026.
- Fetch each report page under a browser user agent.
- Parse the meta description for the overall score and grade, the metric tiles for TTFB, LCP, CLS, Lighthouse mobile and Lighthouse desktop, and the four rubric sections for per-check pass, partial and fail states.
- Keep one record per domain. All 958 reports were for distinct hostnames, so no deduplication was needed.
- Aggregate. No weighting, no outlier removal, no smoothing.
Now the part most published benchmarks leave out.
| # | Limitation | What it does to the numbers |
|---|---|---|
| 1 | The sample is self-selected. People run a speed test because they suspect their site is slow. | The whole distribution skews slow. Treat 63 as the median of worried site owners, not of the web. |
| 2 | Lab data, single run, homepage only. | Per web.dev, lab tools collect data “in a controlled environment with predefined device and network settings” while field tools collect it from real users. Field scores are reported at the 75th percentile. These are not that. |
| 3 | Plugin detection reads headers and HTML signatures. A page that merely names a plugin can be matched to it. | The per-plugin table below is reported and not ranked, and no plugin comparison should be drawn from it. |
| 4 | The TTFB threshold used here is stricter than Google’s. The rubric passes at 200ms; web.dev says “most sites should strive to have a TTFB of 0.8 seconds or less”. | Our fail rate for TTFB is higher than Google’s guidance would produce. Both numbers are given below. |
| 5 | Ten days is a short window. Traffic patterns, CDN incidents and one busy agency can all move a ten-day sample. | Directional, not seasonal. |
Nothing here is a controlled experiment. Groups are compared as they were found, which means every difference below is an association and not a cause.
What 958 sites actually score
| Score band | Sites | Share |
|---|---|---|
| 90 to 100 | 62 | 6.5% |
| 80 to 89 | 121 | 12.6% |
| 70 to 79 | 177 | 18.5% |
| 60 to 69 | 194 | 20.3% |
| 50 to 59 | 175 | 18.3% |
| Below 50 | 229 | 23.9% |
Median 63, mean 62.9, with the middle half of the sample between 50 and 76. Fewer than one site in fifteen reached 90.
Split by rubric dimension, the shape is more interesting than the total:
| Dimension | Median | Share scoring 100 |
|---|---|---|
| Asset optimization | 79 | 43.3% |
| Server response and caching | 56 | 17.7% |
| Core Web Vitals and lab metrics | 60 | 4.2% |
| Platform readiness (WordPress subset) | 75 | 12.7% |
Asset optimization is the dimension people work hardest on, and it is the one the sample is best at. Core Web Vitals is the dimension Google grades, and 4.2% of sites earned full marks. On 89 sites, 9.3% of the sample, asset optimization scored 90 or better while Core Web Vitals came in under 60. Minifying everything is not the same as being fast.
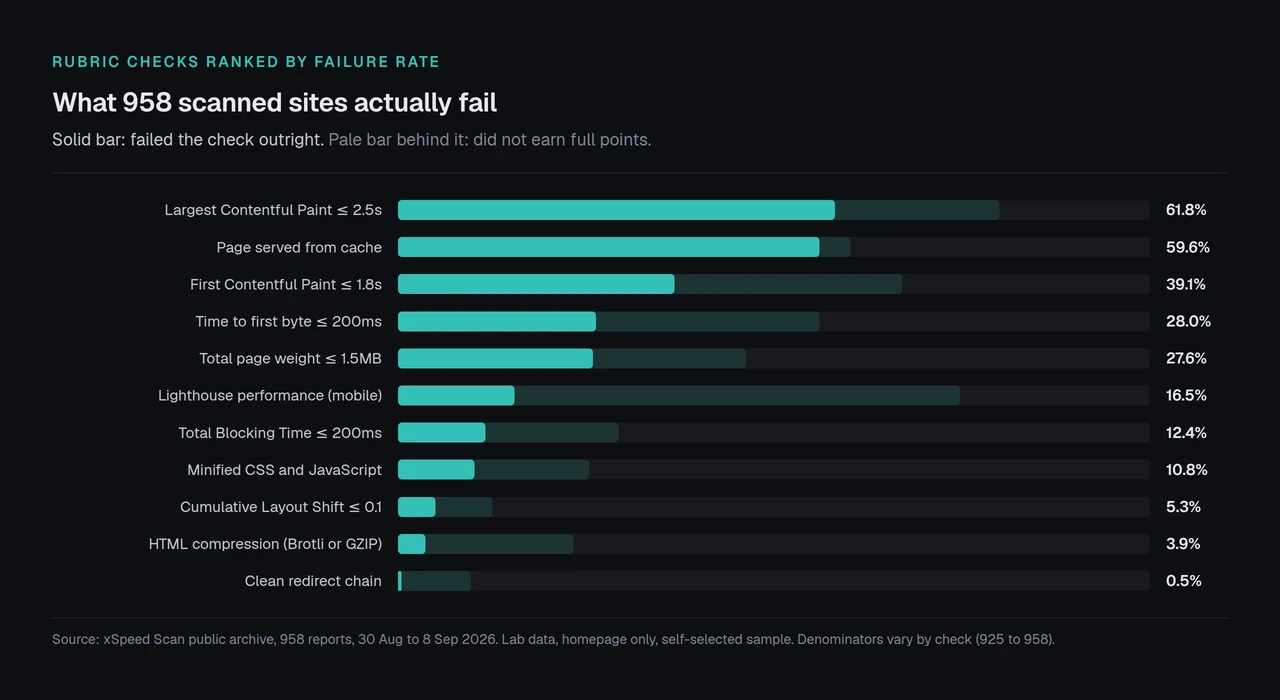
The most-failed check is the one no plugin setting can reach
Ordered by outright failure rate across the whole sample:
| Check | Scored | Fail | Fail rate | Did not earn full points |
|---|---|---|---|---|
| Largest Contentful Paint ≤ 2.5s | 958 | 592 | 61.8% | 85.1% |
| Page served from cache | 925 | 551 | 59.6% | 64.0% |
| First Contentful Paint ≤ 1.8s | 958 | 375 | 39.1% | 71.3% |
| Time to first byte ≤ 200ms | 958 | 268 | 28.0% | 59.6% |
| Total page weight ≤ 1.5MB | 958 | 264 | 27.6% | 49.2% |
| Lighthouse performance (mobile) | 958 | 158 | 16.5% | 79.5% |
| Total Blocking Time ≤ 200ms | 958 | 119 | 12.4% | 31.2% |
| Minified CSS and JavaScript | 952 | 103 | 10.8% | 27.0% |
| Cumulative Layout Shift ≤ 0.1 | 958 | 51 | 5.3% | 13.4% |
| HTML compression (Brotli or GZIP) | 958 | 37 | 3.9% | 24.8% |
| Clean redirect chain | 958 | 5 | 0.5% | 10.3% |
Two things stand out.
Compression and redirects are close to solved. Only 3.9% of sites shipped uncompressed HTML, 720 of 958 were already on Brotli, and redirect chains failed five times in 958. That was the standard advice of 2015, and it worked.
LCP was not solved by any of it. It is the most-failed check in the sample by a wide margin, and web.dev’s CLS reference shows the contrast inside the same metric family: 87.2% of these sites passed CLS at 0.1 or less, which is a layout problem, while 14.9% passed LCP, which is a delivery-and-render problem.
Caching did exactly what it promises and nothing more
This is the finding the rest of the study exists to support. Sites were grouped by what the scanner observed in the response, not by what they had installed.
| Cache state | Sites | Median TTFB | Median LCP | Median score |
|---|---|---|---|---|
| Served from cache | 333 | 121ms | 5.35s | 74 |
| Cache layer present, response not served from it | 41 | 437ms | 6.70s | 61 |
| No cache evidence in headers or HTML | 551 | 442ms | 5.05s | 57 |
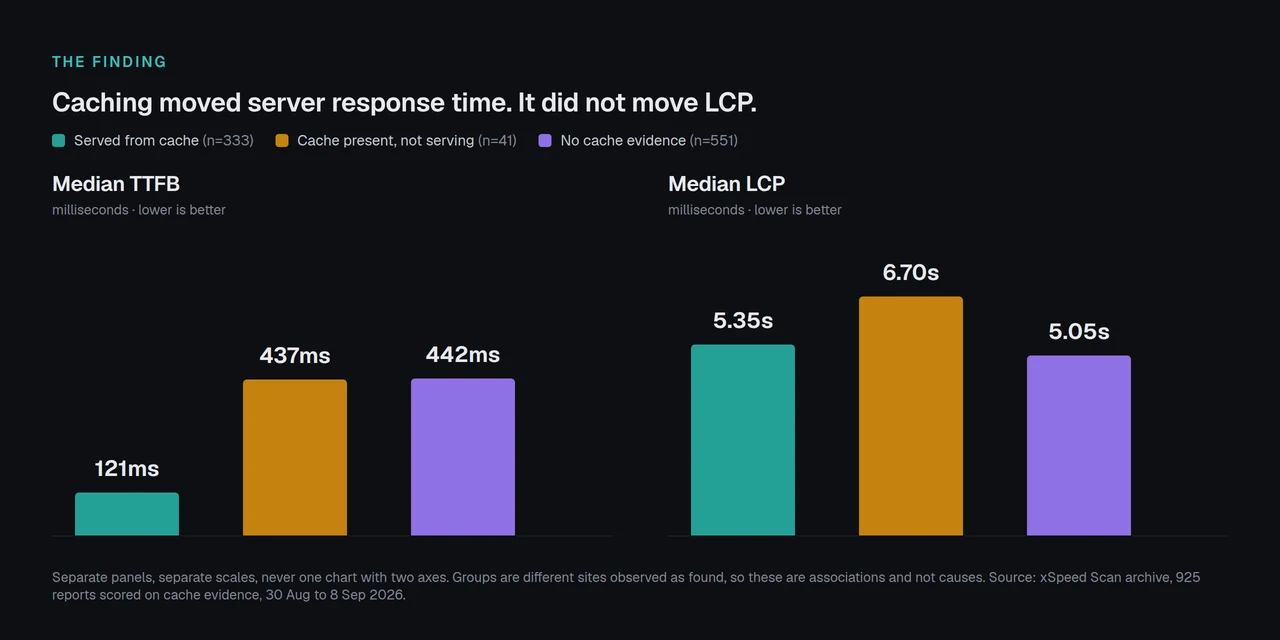
Median TTFB fell from 442ms to 121ms between the uncached and cached groups, a 73% reduction, and the overall score rose 17 points. That is caching doing precisely the job it is sold to do.
Median LCP went from 5.05s to 5.35s. The cached group was not faster on the metric Google grades.
Read that carefully, because it is easy to overstate. These are different sites, not the same sites before and after. Heavier sites are plausibly the ones that end up with a cache layer, and they carry front-end weight a cache never touches. What our own data does not support is the claim we would most like to make, that adding a cache moves Core Web Vitals. Across 958 scans there is no sign of it, and we would rather publish that than sell anyone the wrong fix.
The CDN cut tells the same story from a different angle. A CDN was detected on 521 sites, Cloudflare on 385 of them. Median TTFB was 214ms with a CDN and 420ms without, and the median score was 67 against 59.
The TTFB and LCP quadrant
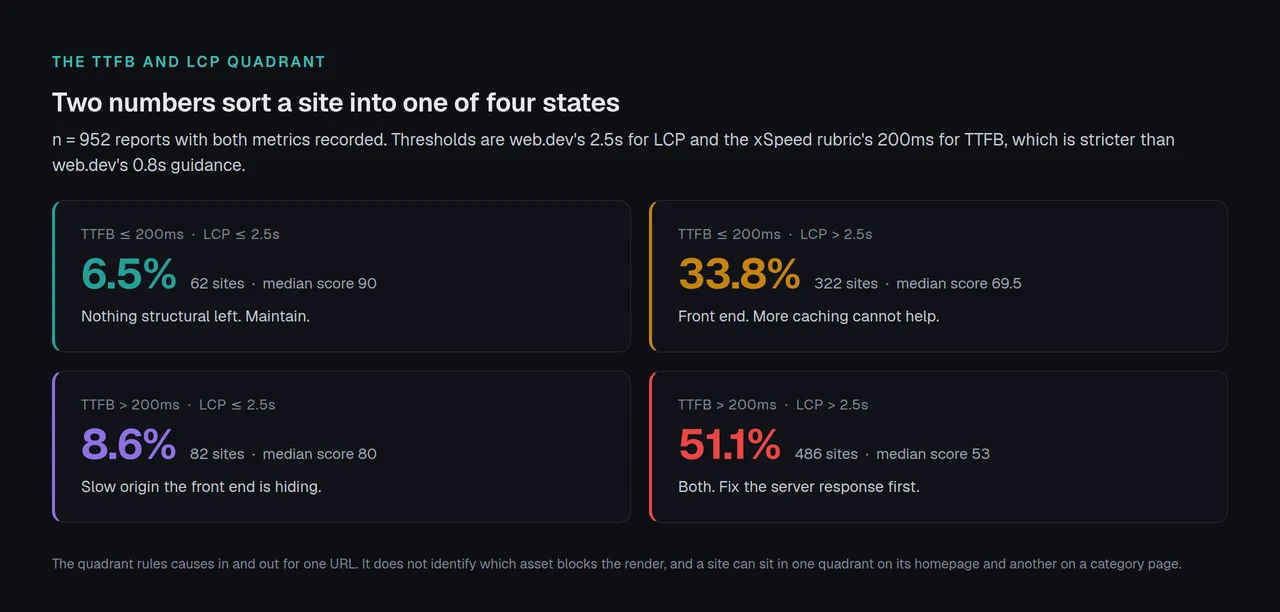
Reading one number at a time is what produces the wrong fix. Reading two together sorts a site into one of four states, and each state has a different set of possible causes. This is the framework the dataset supports.
| Your state | Sites | Share | Median score | What can possibly be wrong |
|---|---|---|---|---|
| TTFB ≤ 200ms and LCP ≤ 2.5s | 62 | 6.5% | 90 | Nothing structural. Maintain. |
| TTFB ≤ 200ms and LCP > 2.5s | 322 | 33.8% | 69.5 | Render-blocking CSS or JS, oversized hero images, web fonts, client-side rendering. The server is not the problem. |
| TTFB > 200ms and LCP ≤ 2.5s | 82 | 8.6% | 80 | A slow origin the front end is hiding. Cheapest wins available. |
| TTFB > 200ms and LCP > 2.5s | 486 | 51.1% | 53 | Both. Fix the server response first, because it is the shorter job, then re-measure. |
The second row is the one worth stopping on. Of the 384 sites in this sample with a TTFB at or under 200ms, 83.9% still failed LCP. A third of the entire sample sits in the state where more caching cannot help, and it is the state most likely to be misdiagnosed, because the site owner has already done the thing every performance article told them to do and the score did not move.
The limitation of this framework, stated plainly. Two thresholds cannot diagnose a site. The quadrant tells you which class of cause is still possible and which is ruled out. It does not tell you which asset is blocking the render, and a site can sit in the top-left quadrant on its homepage and in the bottom-right on a category page. It is a triage tool for a single URL, nothing more.
The WordPress cut: 312 sites, and 45% with no cache plugin at all
Of the 958 reports, 312 were identified as WordPress, 32.6% of the sample. That subset carries the platform checks the rest do not.
| Group | Sites | Median score | Median TTFB |
|---|---|---|---|
| WordPress, a caching plugin detected | 170 | 69 | 243ms |
| WordPress, no caching plugin detected | 142 | 49 | 534ms |
A 20-point median gap, and the WordPress sites without any caching plugin were the worst-scoring identifiable group in the whole dataset. For all the caveats above, that gap is large, consistent with what caching is for, and it lines up with the TTFB result.
The per-plugin breakdown is published below for completeness and should not be read as a ranking. Detection works from response headers and HTML signatures, several cell counts are in single digits, and the sample is self-selected in a way that differs per plugin. A plugin comparison that could survive scrutiny needs one identical site, one host and repeated runs, which is a different study.
| Detected plugin | Sites | Median score | Median TTFB | Served from cache |
|---|---|---|---|---|
| None detected | 142 | 49 | 534ms | 23% |
| LiteSpeed Cache | 99 | 70 | 222ms | 86% |
| xSpeed Cache | 37 | 69 | 239ms | 95% |
| WP Rocket | 20 | 66 | 482ms | 20% |
| NitroPack | 4 | 66 | 360ms | 50% |
| Breeze | 3 | 71 | 120ms | 100% |
| W3 Total Cache | 3 | 69 | 91ms | 0% |
| WP Fastest Cache | 2 | 67 | 684ms | 0% |
| WP Super Cache | 2 | 38 | 602ms | 0% |
A three-site median is a number, not a finding. The bottom five rows are printed so the table is complete, not so it can be sorted.
The column worth reading in that table is the last one. Not the score and not the TTFB, but the share of responses actually served from cache. It runs from 0% to 95%. The counts are too small and too uneven to rank anything, and we are not ranking. What the spread shows is this study’s central finding restated one plugin at a time: the distance between a plugin being present and a plugin doing its job is larger than the distance between plugins.
Our own row, and the disclosure it needs. xSpeed Cache is ours. We build it at WPDeveloper, and this blog is ours too, so read the row knowing that: 37 sites, median score 69, and the highest served-from-cache share in the table at 95%. We are printing that number and telling you not to read it as a ranking, for a reason that has nothing to do with modesty. People who scan an xSpeed site are disproportionately xSpeed users who have already configured it, and a handful of those hostnames are ours. Thirty-seven self-selected sites cannot crown anything, ours included. The ranking that does hold up runs on outside field data, in 9 WP Rocket alternatives ranked on real Core Web Vitals data — it uses an external dataset precisely because our own archive cannot do that job.
A plugin installed is not a plugin working
On 41 sites the scanner found a caching layer in the response and also found that the response itself had not been served from cache. Within the WordPress subset that was 37 of the 170 sites with a plugin detected, or 21.8%.
Their median TTFB was 437ms. WordPress sites with no caching plugin at all had a median TTFB of 534ms. Across the whole sample, sites whose cache was genuinely serving ran at 121ms — a different population, so read that as the scale of the gap rather than a like-for-like third column. On the measure caching exists to move, a plugin that is installed and not serving landed far closer to having nothing installed than to having something that works.
Two explanations account for most of it:
- 🛒 By design. A logged-in session, a cart page or a deliberately excluded route bypasses the cache, and the checkout page should never be cached at all, which the WooCommerce checkout optimization guide covers.
- 🖧 By mismatch. The plugin is installed on a server that cannot run its page cache, which the LiteSpeed Cache on Nginx or Apache analysis measured in detail. That post carries a 60-second response-header check that tells you which of the two you have.
The practical consequence is that “do you have a caching plugin” is the wrong question. “Was this response served from cache” is the right one, and it is a header read away.
Desktop looks fine. Mobile is where the score goes
Both Lighthouse runs were available for 934 sites.
| Measure | Median |
|---|---|
| Lighthouse mobile | 70 |
| Lighthouse desktop | 90 |
| Desktop minus mobile | 13 points |
On 33.7% of sites the gap was 20 points or more. Google grades Core Web Vitals with mobile and desktop segmented, and most sites see more mobile traffic. The desktop score is the number least worth quoting and the one most often quoted.
Running this across a fleet of client sites
An agency reading the table above has a specific version of the problem: the useful unit is not one site but the distribution across forty. Two numbers matter at that scale, the share of sites whose responses are actually being served from cache, and the share sitting in the second quadrant where more caching will not help.
Both are readable per site from a scan report, and both get checked once and then never again. xSpeed Cache exposes its cache state in the X-XSpeed-Cache response header and its scan tooling over MCP, documented in the scan MCP reference, so an assistant can run the sweep instead of a person. LiteSpeed Cache does the same over its own header on LiteSpeed servers, and the header-level differences across the field are in the 80-capability comparison.
Where the bottleneck is the origin rather than the plugin, the answer is the host, and no plugin will rescue a slow one. That is when we point people at xCloud. It is ours — xCloud and WPDeveloper are both Startise companies — and we recommend it for the same reason this study exists: a fast origin is the one thing a caching plugin cannot manufacture, and half the sites measured here need one.
Object caching sits underneath all of this and moves TTFB on database-heavy sites in a way page caching cannot, which is covered in the Redis and Memcached object cache documentation. The WooCommerce use case page covers the store-specific exclusions.
Run the scan on your own site and read the two checks this study is built on. It is free, it needs no account, and it produces the same report every number above came from: xspeedcache.com/scan/.
Common mistakes people make with data like this
- 📉 Reading the headline score as a diagnosis. A 63 tells you where you sit against 957 other worried site owners. It does not tell you what to change.
- 🧪 Treating lab numbers as field numbers. A single Lighthouse run on a homepage is not what Google ranks on, and the two can differ substantially.
- 🔁 Comparing groups and calling it cause. The cached and uncached sites here are different sites, chosen by their owners, not assigned.
- 🧮 Trusting a median built on three rows. Several plugin rows above have single-digit counts and are printed only so the whole table is visible.
- 🖥️ Quoting the desktop score. It was 20 points higher on a third of sites.
- 🔍 Assuming a detected plugin is a working plugin. It was not on 21.8% of the WordPress sites that had one.
Frequently Asked Questions
I installed a caching plugin and my PageSpeed score did not move. What happened? Most likely your site is in the second quadrant, where TTFB was already acceptable and LCP is being set by the front end. That was 33.8% of this sample. Check whether your TTFB was under 200ms before you installed the plugin. If it was, the cache had almost nothing left to give and the remaining time is in render-blocking assets, hero images or fonts.
My TTFB is 90ms and my LCP is 6 seconds. Is the test broken? No, and that combination describes 322 sites here. TTFB measures when the first byte arrives. LCP measures when the largest visible element finishes painting. Everything between those two moments is your CSS, your JavaScript and your images, none of which a page cache touches.
My scan says no caching plugin detected but I definitely have one installed. Why? Detection reads response headers and HTML signatures. A plugin that has been configured not to advertise itself, a page excluded from the cache, or a CDN stripping headers will all produce that result. Check the response header for your plugin directly before assuming the scan is wrong.
I scanned my site twice in an hour and got two different scores. Which one is real? Both, and neither on its own. A single lab run varies with network conditions and origin load. Take three runs and use the middle one.
I got an A on asset optimization and an F overall. How is that possible? Asset optimization and Core Web Vitals are separate dimensions, and 89 sites in this sample scored 90 or better on the first while coming in under 60 on the second. Minified, compressed assets that still block the render still block the render.
My desktop score is 95 and my mobile score is 48. Which should I care about? Mobile, in almost every case. The median gap here was 13 points and a third of sites were 20 points or wider. Google segments Core Web Vitals by device, so a good desktop score does not compensate.
Does a CDN replace a caching plugin? Neither substitutes for the other. Sites with a CDN had a median TTFB of 214ms against 420ms without. A CDN shortens the distance; a page cache removes the work.
Is 63 out of 100 a bad score? It is the median of this sample, made of sites whose owners already suspected a problem. Against that group it is average. Against Google’s thresholds, a site scoring 63 is probably failing LCP, because 61.8% of this sample did.
Can I reproduce these numbers myself? Yes. Every report in our scan archive is public, so you can collect them, parse the metric tiles and the check states, and aggregate. Your counts will differ from ours because the archive grows every day.
Why not just publish which caching plugin is fastest? Because this data cannot answer that. The sites are different, the sample per plugin is uneven, several rows are single digits, and detection is signature-based. A plugin ranking needs one identical site, one host, one theme and repeated runs. A leaderboard built on our own archive would be the most-shared and least-defensible thing we could publish, and it would be ours to answer for.
How often is this worth re-running? Quarterly for a trend, and after any front-end change for a single site. The archive is dated, so the same query rerun in December measures a different ten days.
What to do with your own number
The study reduces to one instruction: measure two things instead of one. TTFB tells you whether your server and cache are doing their job. LCP tells you whether the visitor got a page. In 952 scans with both recorded, only 6.5% of sites passed both, and the gap between the two answers is where the remaining work lives.
Where to start, by what you measured
| What you measured | Start with | Expected effect |
|---|---|---|
| TTFB over 200ms, LCP over 2.5s | Cache layer, then a CDN | Median TTFB in this sample fell 73% with cache evidence present |
| TTFB under 200ms, LCP over 2.5s | Render-blocking CSS and JS, then hero images | No cache change will help; this was 83.9% of fast-TTFB sites |
| Both passing | Re-measure a category or product page | Homepages flatter sites |
| A plugin installed but no cache evidence | Read the response header before changing settings | 21.8% of WordPress sites with a plugin were in this state |
What to do this week:
- Run the free scan on one page that is not your homepage, and write down TTFB and LCP as a pair.
- Place yourself in the quadrant table above before changing any setting.
- If your cache is not serving, read the response header and find out why before buying anything.
- If your TTFB is the problem and your host is the cause, no plugin fixes that — you need a faster origin, and we recommend xCloud. It is ours, from the same group that builds xSpeed. That is the advice for the 51.1% of sites in this study failing TTFB and LCP together, where the server response is the shorter of the two jobs.
- If a plugin is the right answer, we build one, and we would rather you chose it knowing exactly what it does. xSpeed Cache serves pages as static files before PHP and WordPress load, and the free tier already covers page caching, object caching, minification, lazy loading and Cloudflare integration — which is the half of this study a plugin can actually move. What each tier ships is in the free versus Pro breakdown. This dataset cannot tell you we are the best. It can tell you which of your two numbers is broken, and whether a plugin is the right thing to buy at all.
Every scan behind this study is public at xspeedcache.com/scan/all/. It is our data, our scanner and our plugin, and we would still rather you checked it than took our word. If you run a scan and the result contradicts something above, that is a useful result and worth saying out loud.