45% of the WordPress Sites Our Scan Calls Clean Are Failing Google in 2026: Lab Scores Against Field Data

Updated September 2026
Of the 89 WordPress sites our own scanner graded clean on speed, 40 are failing Google’s Core Web Vitals in the field, measured on 26 September 2026 across 1,655 WordPress hosts in the xSpeed Scan archive. The same archive puts the median lab speed score at 94 and the median mobile lab score at 53, a 41-point spread on the same pages.
The comparison you expect from a performance study is fast sites against slow ones. The more useful comparison is the same site measured twice, by two instruments, one of which decides your ranking and one of which does not. This article publishes both verdicts for 353 WordPress hosts, the rate at which each verdict survives a re-measurement, and the rule that follows.
TL;DR: The Verdict That Counts, and the One That Does Not
| If you want… | Do this | Why |
|---|---|---|
| To know whether Google thinks you pass | Read field data (CrUX) for all three Core Web Vitals at the 75th percentile | It is the only instrument that decides the outcome |
| To know what to fix | Read a lab run, on mobile | Lab runs name the file and the audit; field data names nothing |
| To trust a single score | Do not | A repeat scan moved our overall grade on 41.8% of hosts |
| To act on a “clean” verdict | Re-measure first | The clean label held on only 67.3% of re-measurements |
| To check a site with no field data | Accept that you cannot | 78.7% of the WordPress hosts here have none |
Two instruments measure the same page. A lab run loads it once, on one machine, on a fixed network profile. Field data is what real Chrome users actually experienced. According to web.dev’s Web Vitals guide, “Tools that assess Core Web Vitals compliance should consider a page passing if it meets the recommended targets at the 75th percentile for all three of the Core Web Vitals metrics.” That is the rule this study applies.
What “Failing Google” Means, Precisely
Three metrics, three thresholds, each read at the 75th percentile of real page loads:
| Metric | Good | Measures | Source |
|---|---|---|---|
| LCP | ≤ 2.5s | When the largest element finished painting | web.dev, LCP |
| INP | ≤ 200ms | Responsiveness to a real interaction | web.dev, INP |
| CLS | ≤ 0.1 | How much the layout jumped | web.dev, CLS |
All three were re-read on 26 September 2026. A site fails if any one of them is over its threshold.
The lab score is a different arithmetic entirely. Per Chrome’s Lighthouse scoring documentation, the performance score weights Total Blocking Time at 30%, LCP at 25%, CLS at 25%, First Contentful Paint at 10% and Speed Index at 10%. Our post on reading a PageSpeed report works through what that weighting does to the number you see. The short version is that a lab score and a Core Web Vitals verdict are not the same question, and one of them is not the question Google asked.
The Method, and the Six Things It Cannot Tell You
The limitations come before the results, because two of them change how much weight the results can carry.
What we did. Every scan report in the public archive was fetched on 26 September 2026, 2,595 of them, from https://xspeedcache.com/scan/r/sitemap.xml. 1,655 are WordPress. Each report carries server probes, a Lighthouse run graded on desktop and a second graded on mobile, four dimension scores, and, where Google has it, the CrUX field values for that origin. 353 WordPress hosts have at least one field metric. For the re-measurement half, 91 of those hosts had at least one earlier report still linked from their own history table, giving 203 prior reports and 79 pairs comparable on the same graded device.
Limitation 1: most sites cannot be tested at all. Only 353 of 1,655 WordPress hosts here have field data, 21.3%. The other 1,302 have none, because CrUX has eligibility rules. Per Chrome’s CrUX documentation, origins and pages must be “publicly discoverable and there must be a large enough number of visitors” for Google to build a statistically significant dataset. If your site is small, the instrument that decides your ranking has no reading for you, and no tool can invent one.
Limitation 2: the field retention number is flattered. CrUX is, per Chrome’s CrUX API documentation, “a 28-day rolling average of aggregated metrics.” The median gap between our two scans of the same host is 0.4 days, so two consecutive readings share roughly 27 of their 28 days of data. Field data reproducing well over one day is partly arithmetic. It is still the deciding instrument. Its reproducibility over a month is not something this dataset can measure.
Limitation 3: one URL per host. Mostly the homepage. A homepage verdict is not a site verdict.
Limitation 4: this is observational. Sites were scanned because somebody asked for a scan. Nothing here supports a causal claim about any plugin, host or CDN, and none is made.
Limitation 5: the rubric moved. Reports span versions 2026.08.1 to 2026.09.5, and the older rubric graded mobile as its headline, so only desktop-graded scans were compared with desktop-graded scans.
Limitation 6: INP coverage is thinner. 285 hosts carry a field INP against 343 for LCP, so the INP rates rest on a smaller base.
The Instrument Agreement Test
The framework this article contributes. Five steps, and the third and fourth are the ones nobody runs.
- Name the instrument that decides the outcome. For Google rankings that is field data, all three Core Web Vitals, 75th percentile.
- Name the instrument you are actually reading. Usually a lab run. Often a desktop lab run.
- Get both verdicts for the same URL. Not both numbers. Both pass-or-fail verdicts against their own thresholds.
- Re-measure and compute retention for each verdict. Take the same URL, measure again, and record how often each instrument returns the same verdict. This is the step that tells you which number you are allowed to act on.
- Act where they agree. Where they disagree, follow the deciding instrument, and treat the other as a list of suspects rather than a verdict.
The limitation of the test itself: retention conflates instrument noise with real site change, and separating them needs a control this dataset does not have. A site that genuinely got slower between two scans counts against retention here exactly as a noisy run does.
Result 1: The Two Instruments Disagree on a Third of Sites
353 WordPress hosts have both a lab verdict and a field verdict. Reading the lab verdict as a pass at a speed dimension of 90 or better:
| Our lab verdict | Google says pass | Google says FAIL | Row total |
|---|---|---|---|
| Our scan says clean | 49 | 40 | 89 |
| Our scan says no | 79 | 185 | 264 |
| Column total | 128 | 225 | 353 |
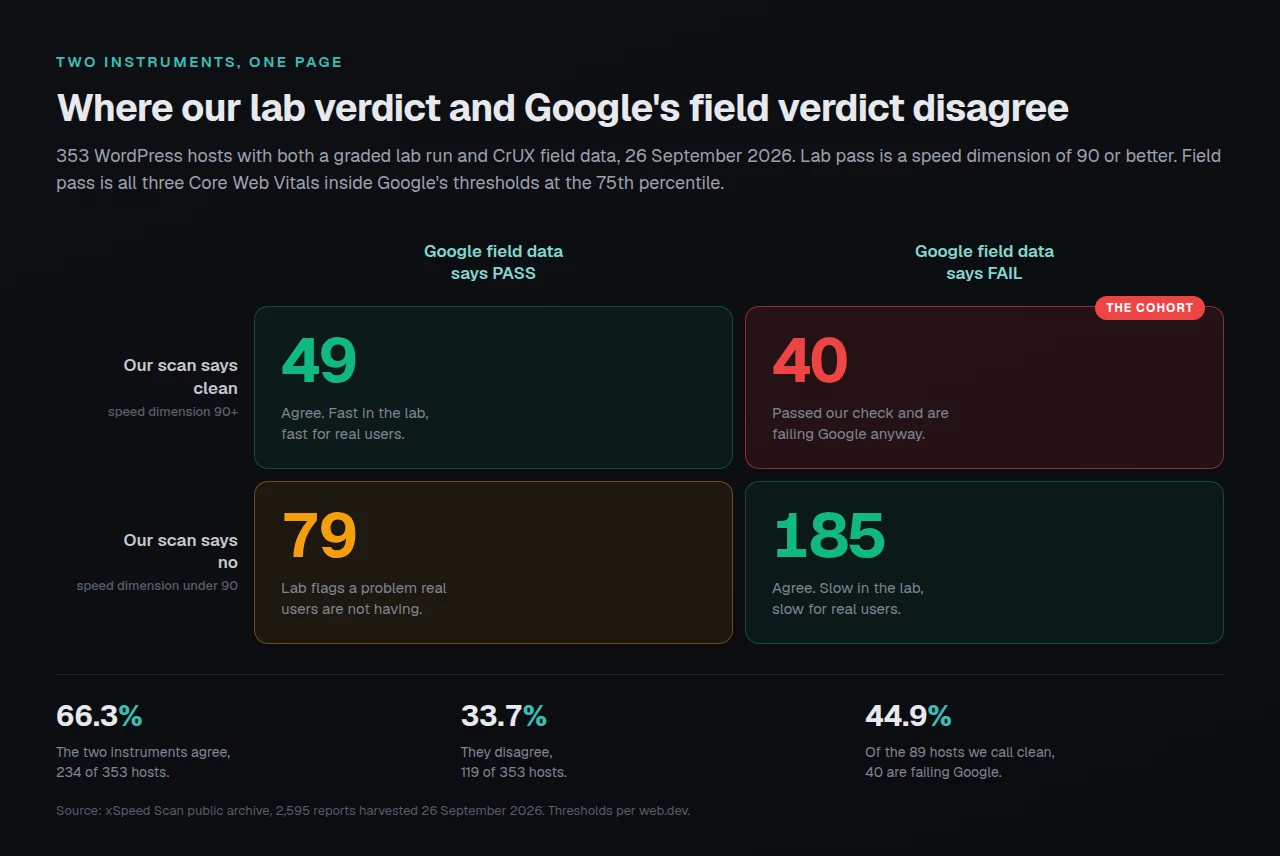
They agree on 234 of 353 hosts, 66.3%. They disagree on 119, 33.7%. The cell that matters is the top right: of the 89 hosts our own scanner calls clean, 40 are failing Google, 44.9%. Close to half.
The bottom left cell is worth a sentence too. 79 hosts fail our lab check and pass Google. A lab run flagging a problem real users are not having is the cheaper error of the two, but it is the same disagreement, and it is 22.4% of the sample.
Result 2: The Headline Score Is the Desktop Run
The disagreement has a mechanism, and it is not subtle. 883 of the 1,655 WordPress hosts carry both a desktop-graded and a mobile-graded Lighthouse run. Comparing the two on the same pages:
| Measure | Desktop (the headline) | Mobile | Gap |
|---|---|---|---|
| Median speed dimension | 94 | 53 | 41 |
| Median Lighthouse score | 88 | 63 | 25 |
| Median per-host difference | — | — | 29 points |
| 90th percentile per-host difference | — | — | 46 points |
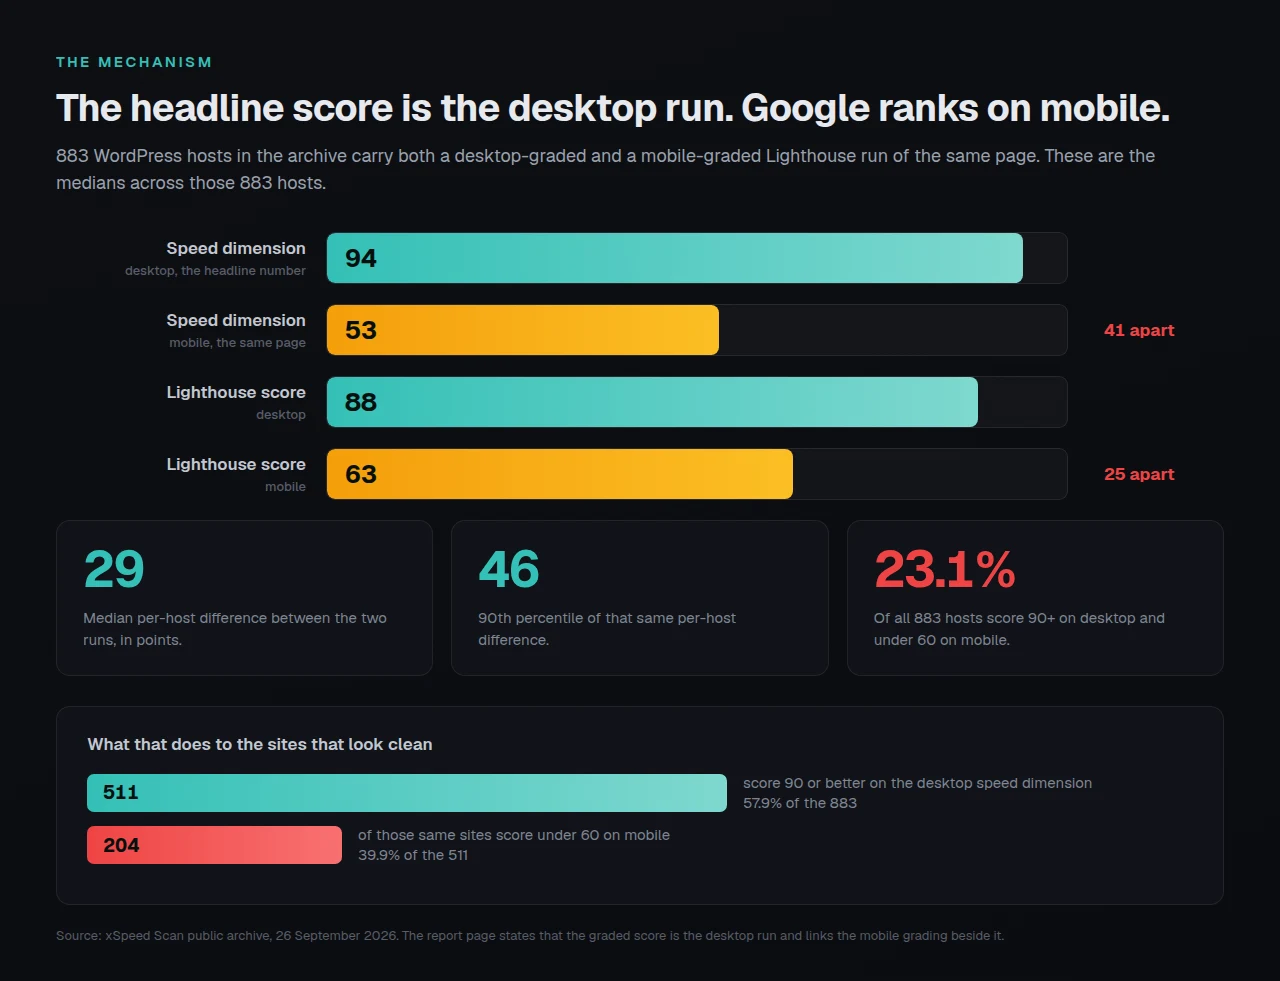
511 of the 883 hosts score 90 or better on the desktop speed dimension, 57.9%. Of those 511, 204 score under 60 on the mobile run of the same page, 39.9% of them, and 23.1% of every dual-view WordPress host in the archive. The report page is explicit about which run it grades, stating that “the graded score is the desktop run” and linking the mobile grading beside it. The number a person reads first is still the desktop one.
Google’s page experience signals are mobile-first and drawn from the field. So a site can read 94 on the instrument in front of it and be judged on a number 41 points lower. That is the whole of the cohort in one sentence: they did not fail a test they passed. They passed a different test.
Result 3: LCP Is What Fails, and INP Mostly Is Not
We expected interactivity to dominate, because no caching plugin touches main-thread JavaScript. The data says otherwise, and the expectation was wrong.
| Field metric | Failing | Of hosts measured | Median value |
|---|---|---|---|
| LCP > 2.5s | 209 | 60.9% of 343 | 2,938ms |
| CLS > 0.1 | 66 | 18.7% of 353 | 0.000 |
| INP > 200ms | 39 | 13.7% of 285 | 95ms |
225 of 353 hosts fail at least one, 63.7%. The failure is overwhelmingly loading, not responsiveness. LCP alone accounts for 127 of the 225; LCP with CLS another 48; LCP with INP 27; all three 7. Only 5 hosts fail on INP alone, and 11 on CLS alone.
Inside the cohort of 40 the concentration is sharper still: 37 fail LCP, 11 fail CLS, and exactly one fails INP. If you are in this group, the thing to fix is almost certainly how fast your largest element arrives on a phone.
Result 4: Which Verdict Survives a Re-Measurement
This is the test that decides whether the cohort above is real or an artifact. 79 pairs of scans, same host, both graded on desktop, median 0.4 days apart.
| Reproducibility | Lab verdict | Field verdict |
|---|---|---|
| Median change, same host | 3 points | 8ms (0.3%) |
| 90th percentile change | 18 points | — |
| Largest change observed | 26 points | — |
| “Clean” verdict held on re-measure | 67.3% (33 of 49) | — |
| “Fail” verdict held on re-measure | — | 97.4% (149 of 153) |
| “Pass” verdict held on re-measure | — | 100% (31 of 31) |
| Overall letter grade changed | 41.8% of hosts | — |
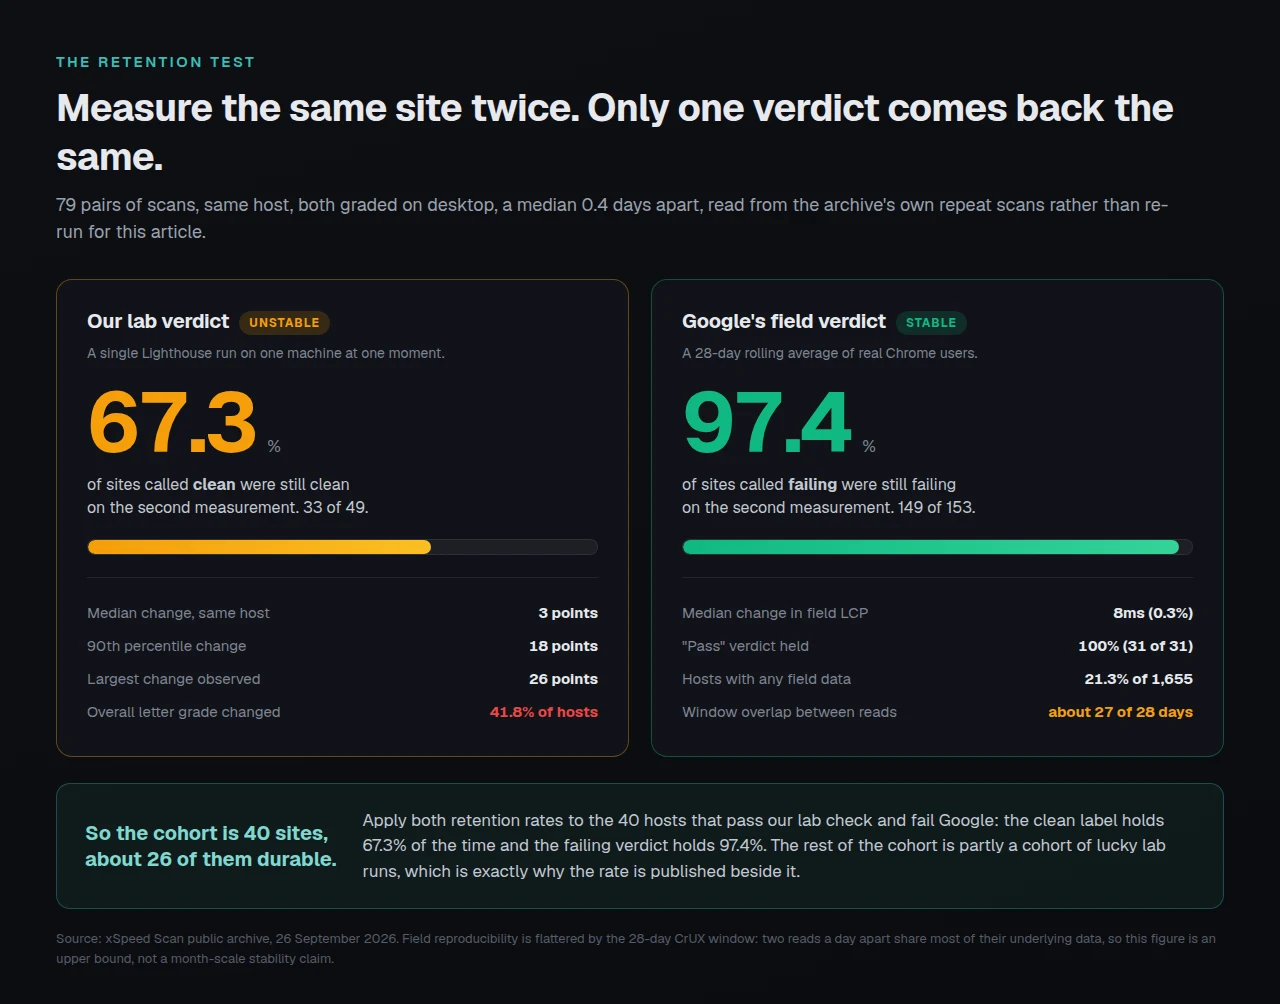
A third of the sites our lab run called clean were not clean when measured again. The field verdict came back identical 97.4% of the time on a failing site and 100% on a passing one, subject to limitation 2 above.
Two controlled same-day re-scans land in the same place. traumaterapiakeskus.com moved from a speed dimension of 96 to 97 while its field LCP moved 2,856ms to 3,018ms, failing both times; finntensid.fi moved 96 to 99 with field LCP 3,863ms to 3,782ms, also failing both times. The public scanner allows four scans per caller per ten minutes, which is why the retention figure rests on the archive’s own repeat scans.
Applying the two retention rates to the cohort gives the honest size. 40 hosts, a lab-clean label that holds 67.3% of the time, a field-fail verdict that holds 97.4%: about 26 of the 40 are durably in this state. The rest are partly a cohort of lucky lab runs. Our earlier benchmark protocol post established the noise floor that predicts this, and it predicted it correctly.
What the Failing Cohort Has in Common
Comparing the 40 lab-clean field-failing hosts against the 49 lab-clean field-passing ones:
| Median | Cohort (fails Google) | Control (passes Google) |
|---|---|---|
| Field LCP | 3,688ms | 1,531ms |
| Lab LCP, desktop | 1,145ms | 1,000ms |
| Lab LCP, mobile | 6,929ms | 4,276ms |
| Mobile page weight | 1.59MB | 1.04MB |
| Mobile Total Blocking Time | 55ms | 21ms |
| TTFB | 247ms | 156ms |
| Asset optimization dimension | 44.5 | 57 |
| Delivery dimension | 78 | 91 |
| CDN detected | 52.5% | 69.4% |
The desktop lab LCP barely separates the two groups, 1,145ms against 1,000ms, and both are comfortably inside the 2.5s threshold. The mobile lab LCP separates them by 2.7 seconds. Page weight is the largest structural difference, and we measured the mechanism behind it separately: format conversion saves far less than resizing does, a median 38.4% against 92.8% on the same photographs.
Note what is absent. Server response is not the story: 247ms against 156ms is a real gap and a small one beside a 2.2-second field LCP difference. That is the finding our cache ceiling study published for the whole archive, where subtracting the entire server response still leaves 93.4% of failing WordPress sites failing. Their origins are fine and their phones are not.
The Numbers That Do Not Flatter Us
Two columns in this dataset make us look worse, and they are published on the same terms as everything else.
Sites running a caching plugin are over-represented in the failing cohort. 75.0% of the cohort runs one against 55.1% of the control. Sites running xSpeed are also over-represented: 35.0% against 14.3%. Our own plugin appears more often among the sites failing Google than among the sites passing it.
The honest reading is the one our agent visibility study reached about a different metric. People install a caching plugin because their site was slow, so selection runs the other way round from causation and this dataset cannot separate the two. What it can say is that installing a cache did not move these sites out of the failing group.
Six of the 40 are ours. Startise and WPDeveloper properties, and the disclosure matters because they are the clearest illustration in the set:
| Our site | Desktop speed dimension | Mobile speed dimension | Field LCP |
|---|---|---|---|
| startise.com | 98 | 50 | 3,676ms |
| embedpress.com | 98 | 52 | 2,641ms |
| shopidevs.com | 98 | 57 | 2,761ms |
| wedocs.co | 97 | 62 | 3,254ms |
| essential-addons.com | 91 | 40 | 3,273ms |
| sslcommerz.com | 90 | 50 | 4,163ms |
startise.com reads 98 on a section of our own report headed Core Web Vitals, with five of five checks passed, while Google’s field data for the same origin shows an LCP of 3.7 seconds. WPDeveloper is a Startise company and xSpeed is ours, so this is our scanner, our rubric and our corporate site, disagreeing with each other in public. The report is not lying. It is grading a desktop lab run accurately and calling the section Core Web Vitals, and a reader who stops at the grade will conclude something untrue.
Auditing Forty Sites Without Forty Logins
The test above is four reads per site, which is fine for one site and not fine for forty. For an agency the practical shape is different: get both verdicts for every site on one connection, then sort by disagreement rather than by score.
| Step | Per site | Across a fleet |
|---|---|---|
| Field verdict | Search Console or the CrUX API | One API pass over every origin |
| Mobile lab run | Any scanner | One scan job per site, queued |
| Cache and settings state | Site dashboard login | One MCP connection |
| Sort by | Score | Disagreement between the two verdicts |
xSpeed Cache is ours, built by WPDeveloper, and it ships an MCP server on the free tier so an assistant can pull cache state, settings and scores across a fleet without a per-site login. xSpeed Hub drives the whole fleet from one connection, which makes a forty-site sweep a single pass. The scan MCP documentation covers connecting the scanner, free and with no account.
Run the free scan on your own site: xspeedcache.com/scan
Where the disagreement turns out to be a genuinely slow origin rather than a heavy page, the fix is the host. We recommend xCloud for that, and it is ours: xCloud and WPDeveloper are both Startise companies. For the far more common case here, a fast origin and a heavy mobile page, three levers do most of the work:
- 🖼️ Image dimensions. Resize before you convert. The saving is a square, not a constant.
- 🎨 Render-blocking CSS. Inline what the first screen needs and defer the rest.
- 🗄️ Browser caching. Our browser cache documentation covers the headers.
WooCommerce stores hit this pattern hardest, because product images are the largest element on almost every page that matters.
Common Mistakes People Make With a Speed Score
- 📱 Reading a desktop score and drawing a mobile conclusion. The median gap on the same page is 29 points. This is the single most common version of the error.
- 🔁 Acting on one run. Our overall grade changed on 41.8% of repeat scans. Run it three times before you believe a change.
- 🧪 Treating a lab score as a Core Web Vitals verdict. Lighthouse weights Total Blocking Time at 30%, and Total Blocking Time is not a Core Web Vital.
- 🏗️ Fixing the server first by default. In this cohort the origin is 247ms and the field LCP is 3,688ms.
- 🖼️ Converting images without resizing them. Format buys a better constant. Dimensions buy a square.
- 📉 Assuming no field data means no problem. 78.7% of the WordPress hosts here have none, and absence is not a pass.
Frequently Asked Questions
Why does my PageSpeed score say 95 when Search Console says my Core Web Vitals are failing?
Because they are different instruments. Search Console reports field data from real Chrome users at the 75th percentile, and a PageSpeed score is a single lab run whose default is often desktop. On 353 WordPress hosts here the two verdicts disagreed 33.7% of the time.
I fixed everything my speed test flagged and my rankings did not move. What did I miss?
Check whether the test was grading mobile. In this archive 204 hosts score 90 or better on desktop and under 60 on mobile for the same page. If you optimized against the desktop run, you may have fixed a page that was already passing.
My score keeps changing and I have not touched the site. Is the tool broken?
No, and this is measurable rather than a matter of opinion. Across 79 repeat scans of the same hosts the median change was 3 points, the 90th percentile was 18, and the overall letter grade changed on 41.8%. Our benchmark protocol sets out how to measure your own noise floor before you compare anything.
I have no field data in Search Console at all. What do I do?
You measure with lab runs on mobile and accept that you cannot confirm the outcome. CrUX needs enough visitors to publish a statistically significant dataset, and 78.7% of the WordPress hosts in this archive do not have it.
I installed a caching plugin and my LCP did not improve. Why not?
Most likely because your LCP was never mostly server time. In this cohort the median TTFB is 247ms against a median field LCP of 3,688ms. Our cache ceiling study found 93.4% of failing WordPress sites still fail with the entire server response subtracted.
Which of the three Core Web Vitals should I look at first?
LCP, by a wide margin. 209 of 343 measured hosts fail it against 39 of 285 for INP. Fix loading before responsiveness unless your own field data says otherwise.
Does a CDN fix this?
Not on its own. 52.5% of the failing cohort has a CDN detected against 69.4% of the passing group, so it correlates, but a CDN moves bytes faster and does not make them fewer. Our headroom study covers when network-layer work has room to help.
How often should I re-measure?
Field data updates on a 28-day rolling average, so checking it daily tells you almost nothing. Lab runs are worth running in threes on the day you change something, and our free scanner keeps every report at a permanent URL so you can compare like with like.
Can I run this test myself?
Yes. Get your field verdict from Search Console or the CrUX API, get a mobile lab run from any scanner, and compare the verdicts rather than the numbers. Then re-run the lab side twice more before you act on it.
Why is CLS median 0.000 but 18.7% of sites fail it?
Because layout shift is bimodal. Most sites reserve space correctly and score near zero, and a minority have one element that moves badly. A median hides that, which is why the fail rate is reported beside it.
Does xSpeed fix the LCP problem this article describes?
It closes part of it. Page caching, browser caching, minification and image conversion all reduce what a phone has to fetch, and the free tier covers caching, compression and lazy loading. It does not resize an image you uploaded at 4000px or remove a render-blocking font from your theme, and those matter more in this cohort.
Conclusion: Read the Verdict That Decides the Outcome
The 40 sites in this cohort did not fail a test they passed. They passed a desktop lab test and were judged on mobile field data, and on the same pages those two instruments sit a median 29 points apart.
| Your goal | Read this | Then do this |
|---|---|---|
| Know whether you pass Google | Field data, all three metrics, 75th percentile | Nothing else settles it |
| Find what to fix | A mobile lab run | Start with the largest element |
| Confirm a change worked | Three lab runs, then field data in 28 days | Never one run |
| Audit a fleet | Both verdicts per site, sorted by disagreement | Fix the disagreements first |
What to do this week: pull your field verdict for all three Core Web Vitals at the 75th percentile, not a lab score. Run a mobile lab test on the same URL and write both verdicts down. If they disagree, believe the field one and treat the lab run as a list of suspects. Re-run the lab side three times before acting on any single number, then close the cheapest gaps it names: image dimensions, render-blocking CSS and browser caching. xSpeed Cache handles caching and compression on the free tier, and Pro is $29 a year or $79 for a lifetime licence at the founding price, with a 14-day money-back guarantee. The 80-capability comparison shows where it sits against the alternatives.
If you run this test on your own site and the two instruments disagree, the interesting part is which way. We would rather see the cases where our lab run flagged a problem your users were not having, because that is the error we can actually fix in the rubric.