Adding a CDN Took 29ms Off WordPress TTFB in 2026. Making the Edge Answer Took 298
Updated September 2026
We probed 1,748 WordPress sites in our own scan archive between 30 August and 28 September 2026. A CDN signature answered on 585 of them, 33.5%. Of the 556 sites behind Cloudflare, 330 returned cf-cache-status: DYNAMIC, which Cloudflare’s own documentation defines as a request that “went to the origin web server without a cache lookup”.
The comparison people expect here is CDN against no CDN. The more useful comparison is a CDN that answers against a CDN that only watches, because the gap between those two is ten times the gap between having one and not having one.
Quick Summary: Which CDN State You Are In, and What It Costs
| If you want… | Do this | Why |
|---|---|---|
| To know whether your CDN is working | Read cf-cache-status on your homepage | DYNAMIC means the edge forwarded every request, and 59.4% of Cloudflare sites here do |
| A faster first byte | Get the edge to cache HTML, not merely to sit in front | Median TTFB is 386ms on a CDN that forwards and 117.5ms on one that answers |
| To judge whether a CDN helped | Look at field data, never at a one-location lab score | Our own lab LCP ranks the edge-hit group worst of three; Google’s field data ranks it best |
How We Measured This, and the Five Things It Cannot Tell You
The limitations come first, because a reader who knows the method’s shape can decide how far to trust each number.
The population. 2,698 scan reports on 2,698 distinct hostnames, harvested from our own report index on 28 September 2026 with zero fetch errors. 1,748 are WordPress. Every one of those carries a server probe measured from Vilnius, Lithuania, best of two requests. 961 also carry a mobile Lighthouse run, because the dual-view schema arrived partway through the window. 235 carry a Chrome User Experience Report mobile LCP.
It is observational, so nothing here is causal. Sites arrive because somebody chose to scan them, and nobody randomly assigned a CDN to half of them. Every comparison below is between populations that differ in more ways than the one being reported.
CDN detection reads headers, so it undercounts. A signature-based detector sees Cloudflare, Fastly and Bunny; it does not see an origin-pull CDN that strips its own headers. We can put a number on the leak: 246 of the 1,163 hosts with no CDN name, 21.2%, carry an edge fingerprint anyway. Those 246 have a median TTFB of 451ms against 407ms for hosts with no fingerprint at all, so the contamination sits in the slow half of the no-CDN group and makes the CDN advantage look smaller rather than larger.
The edge verdict is readable for Cloudflare and nothing else. The state axis below depends on cf-cache-status, so it applies to the 556 Cloudflare sites, which are 95.0% of every CDN we detected. The other 29 hosts are reported as their own row with no edge verdict.
One probe, one moment, one place. A site that forwards at 03:00 UTC may serve an edge hit an hour later, and TTFB from Vilnius includes the network distance a CDN is sold to reduce.
Field data covers 13.4% of the sample, and the covered sites are the popular ones. Per Chrome’s CrUX documentation, an origin must be “publicly discoverable and there must be a large enough number of visitors” to appear at all. So the field half of this study is a sample of busier sites, and the 48-host and 56-host cells in it are small.
Two Thirds of WordPress Sites Have No CDN At All
| Cohort | Hosts | With a CDN signature |
|---|---|---|
| Every site in the archive | 2,698 | 42.2% |
| WordPress | 1,748 | 33.5% |
| Everything that is not WordPress | 950 | 58.2% |
WordPress sits 24.7 points behind the rest of the archive, and that gap is mostly a platform story: the Next.js, Astro and Vercel sites in here deploy onto an edge network by default, while a WordPress site starts on one server in one city.
Among the 585 WordPress sites that do have one, the market is not a market:
| CDN | Hosts | Share of CDN sites |
|---|---|---|
| Cloudflare | 556 | 95.0% |
| Varnish edge | 12 | 2.1% |
| Sucuri | 9 | 1.5% |
| BunnyCDN, Fastly, Vercel Edge | 8 | 1.4% |
For WordPress, “should I use a CDN” is in practice “should I put Cloudflare in front”, and that single fact is what makes the next section measurable at all.
The Rung Nobody Counts: Cloudflare Is In Front and the Page Still Comes From Your Server
330 of the 556 Cloudflare sites, 59.4%, returned cf-cache-status: DYNAMIC. Cloudflare’s cache-status reference states that DYNAMIC means “Cloudflare determined at request time that the asset is not eligible for cache, so the request went to the origin web server without a cache lookup”.
This is not a misconfiguration. It is the documented default. Cloudflare’s own default cache behavior page, last modified 14 September 2026, states that “Cloudflare only caches based on file extension and not by MIME type. The Cloudflare CDN does not cache HTML or JSON by default.” Our Cloudflare and WordPress cache guide walks the 56 extensions that are on that list, and HTML is absent from all of them.
So three of every five WordPress sites on Cloudflare are paying the DNS change, keeping the TLS termination, getting the WAF, and having every single page request travel to their origin anyway.
We verified the reading by hand on 28 September rather than trusting our own field name, probing with a browser user agent:
- ✅ 14 hosts marked with a dynamic edge fingerprint: 13 of 13 that answered returned
cf-cache-status: DYNAMIC. - ✅ 14 hosts with no such fingerprint: 12 of 13 returned
HITorREVALIDATED, and one returned no cache-status header at all.
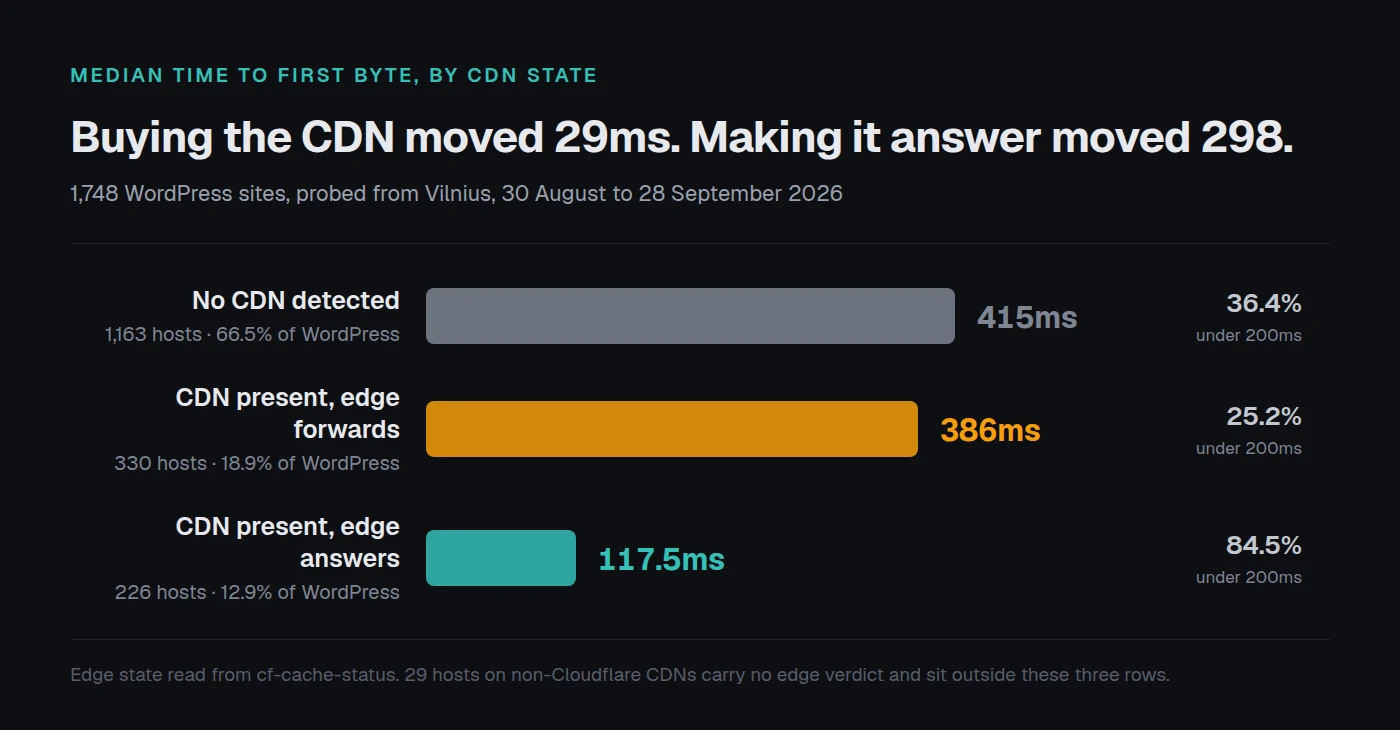
That gives three rungs, plus a fourth row for the CDNs whose edge state we cannot read:
What Each Rung Actually Buys, Measured
| State | Hosts | Share | Median TTFB | TTFB ≤ 200ms | Origin cache hit | Brotli | Delivery score |
|---|---|---|---|---|---|---|---|
| No CDN detected | 1,163 | 66.5% | 415ms | 36.4% | 58.0% | 59.9% | 67 |
| CDN present, edge forwards | 330 | 18.9% | 386ms | 25.2% | 63.0% | 98.8% | 70 |
| CDN present, edge answers | 226 | 12.9% | 117.5ms | 84.5% | 91.2% | 98.7% | 92 |
| Other CDN, no edge verdict | 29 | 1.7% | 119ms | — | 62.1% | 17.2% | 70 |
Read the middle two rows against each other and the whole post is in them. Putting a CDN in front of WordPress moved the median first byte by 29ms. Getting that CDN to answer from its own cache moved it by 298ms. Ten times the return, from the same vendor, on the same DNS change.
The middle rung is worse than no CDN on one measure. Only 25.2% of the forwarding group answered within 200ms, against 36.4% of sites with no CDN at all, because a forwarding edge adds a hop and returns nothing for it.
Two things the rungs do not explain, and both are worth knowing before you buy:
- ⚡ Brotli comes free. 98.8% of the forwarding group serves Brotli-compressed HTML against 59.9% of the no-CDN group, where 29 hosts still serve nothing compressed at all. That win arrives whether or not the edge caches anything.
- 🧱 Asset cache policy does not. The efficient-cache-policy check passes on 19.1% of no-CDN sites, 17.9% of forwarding sites and 14.6% of edge-answering sites. A CDN repeats the
Cache-Controlheaders your origin sends.
Does a CDN Move LCP? Our Own Lab Says No and Google’s Real Users Say Yes
This is the question the study was built to answer, and the two halves of our own report disagree about it.
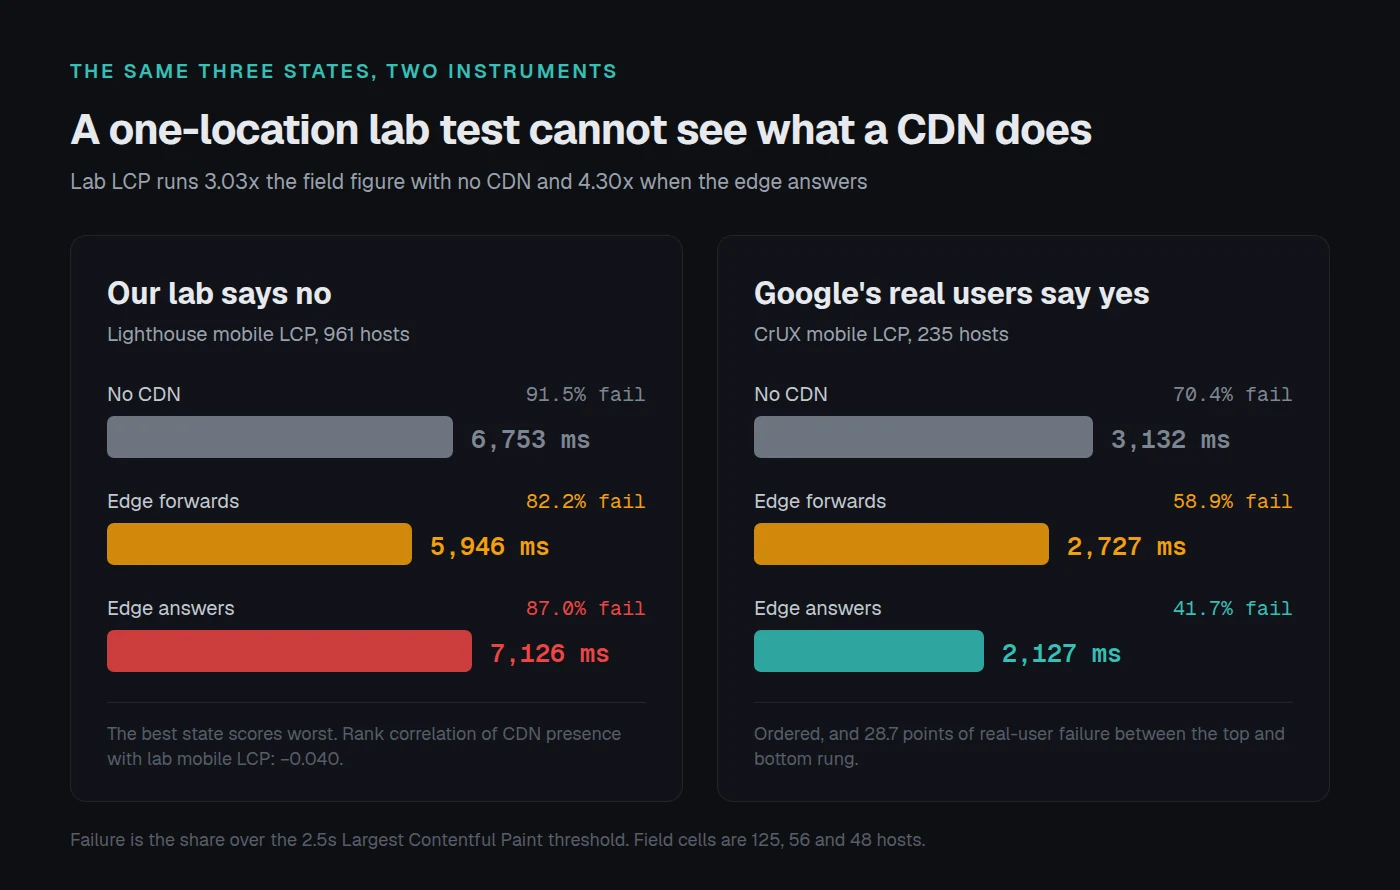
In the lab, the ladder does not sort LCP at all. Across the 961 WordPress hosts with a mobile Lighthouse run, median mobile LCP is 6,753ms with no CDN, 5,946ms on a forwarding edge and 7,126ms on an answering one. The best rung is the worst number. Spearman rank correlation against mobile LCP is −0.040 for CDN presence and +0.710 for transfer weight, which reproduces the +0.706 our page weight study measured on a smaller sample four days earlier.
In the field, the ladder sorts LCP cleanly and monotonically.
| State | Hosts with CrUX | Field mobile LCP p50 | Over 2.5s |
|---|---|---|---|
| No CDN detected | 125 | 3,132ms | 70.4% |
| CDN present, edge forwards | 56 | 2,727ms | 58.9% |
| CDN present, edge answers | 48 | 2,127ms | 41.7% |
28.7 percentage points of real-user LCP failure separate the top rung from the bottom one, in the same direction as the TTFB ladder, on data our own lab score ranks backwards.
The reason is in web.dev’s own LCP reference, which notes that field measurement includes “connection set up time, redirect time, and other Time To First Byte (TTFB) delays which can be significant when measured in the field and can lead to differences between field and lab measurements”. A CDN’s entire job is shortening the distance between a visitor and a response. A lab test run from one city on a fixed throttled connection has one distance in it, and it is not yours. Our lab-against-field study found the two verdicts disagreeing on a third of sites.
The ratio between the two numbers makes the blind spot precise. Lab mobile LCP runs 3.03 times the field figure on no-CDN sites, 3.13 times on forwarding sites and 4.30 times on edge-answering sites. Our lab number overstates the wait most exactly where the CDN is doing the most work.
Weight is the obvious confound, so we controlled for it. CDN sites in the field cohort are lighter, at a median 2,645KB against 2,966KB:
| Mobile transfer weight | CDN field LCP | Over 2.5s | No CDN field LCP | Over 2.5s |
|---|---|---|---|---|
| Under 1,000KB | 1,671ms | 30.4% | 1,910ms | 31.8% |
| 1,000 to 2,500KB | 1,989ms | 36.7% | 2,991ms | 66.7% |
| Over 2,500KB | 3,092ms | 71.9% | 3,620ms | 85.1% |
The gap is widest in the middle band, at 30 percentage points, and nearly vanishes in the lightest one, which is what the page weight study predicts: under 1,000KB the critical path decides and the network has already finished. A CDN also moves only the metric it should, since field INP is 142.5ms on CDN sites against 130ms without one and median field CLS is 0.00 in both groups.
The CDN State Ladder: Finding Your Rung in Two Response Headers
The framework this study produces is a ladder with a stopping rule, not a recommendation to buy anything. Five steps, all free, every one falsifiable from your own terminal.
- Read the edge header.
curl -sI https://yoursite.com/ | grep -i cf-cache-status.HITorREVALIDATEDputs you on the top rung,DYNAMICorBYPASSon the middle one, and no header with no other CDN signature on the bottom rung. - Read the origin header in the same response. Look for
x-cache,x-litespeed-cacheor your plugin’s own header. The two states are independent, and the combination decides your next move. - Fix the rung you are on. Bottom rung with no origin cache: install a page cache first, because that group’s median TTFB is 710ms against 214ms for the no-CDN sites that do return one, and our TTFB guide covers which number to reduce. Middle rung: the edge is the cheapest remaining win. Top rung: stop.
- Judge the result on field data, not a single lab run. Wait 28 days and read your CrUX LCP, because that is the only measurement with real distances in it.
- Stop if you have no field data. Below CrUX’s visitor threshold there is no way to confirm a CDN helped, so make the change for the TTFB you can measure and leave the LCP claim alone.
What the ladder cannot do. It reads one URL at one moment, so it cannot report your edge hit ratio over a week, and it groups BYPASS with DYNAMIC although they have different causes. It also says nothing about sites whose bottleneck was never the network, which our cache headroom study covers with its own break-even model.
Any site’s current rung is readable in one pass with the free xSpeed Scan, which reports the CDN signature, the edge verdict and the server probe in the same report and needs no account.
Where Our Own Rubric Underrates This
Our scan grades a CDN as check D5, in the delivery dimension, at weight 3 of 100, flagged optional and described in the report as a bonus when present. A site with no CDN loses nothing for it. TTFB, by comparison, is worth 8 points and cache evidence 7.
That calibration is defensible for the forwarding rung, which buys 29ms. It is wrong for the answering rung, which moves the median first byte by 298ms and separates real-user LCP failure by 28.7 points. Worse, D5 scores presence rather than state: all 556 Cloudflare sites here pass it identically, including the 330 whose edge never answers.
This is our own scanner and our own rubric, and the finding goes to the team that owns it rather than into a footnote.
Our Own Users’ Sites, Counted Both Ways
393 of the 961 hosts in the lab study run xSpeed Cache, which is ours. Both directions, under one caveat:
| Measure | xSpeed sites (393) | Everything else (568) |
|---|---|---|
| CDN detected | 31.6% | 39.3% |
| Median probe TTFB | 223ms | 305.5ms |
| Origin cache hit | 84.5% | 50.0% |
| Median delivery score | 76 | 67 |
| Median mobile transfer weight | 2,073KB | 1,799KB |
| Median lab mobile LCP | 7,201ms | 6,302ms |
Our own users cache better and reach the first byte faster, and their pages are heavier and their lab LCP is worse. The field cohort is harder on us still: among 64 xSpeed sites with CrUX data, median field LCP is 3,687ms and 76.6% fail, against 2,626ms and 57.3% for the 171 that are not ours.
The selection effect is the honest reading. A site installs a caching plugin because it is slow, so the sites arriving at our scanner with one already installed are a slower population before we touch anything, and the same split in the same direction shows up in our 958-site scan dataset.
One number in the table is a real finding about our own users. Our sites adopt CDNs less often, 31.6% against 39.3%, and 44.2% of the entire forwarding rung runs xSpeed Cache against 28.8% of the answering rung. A cohort that has already solved its origin cache is over-represented in exactly the state where the edge gives nothing back.
Reading the Ladder Across Twenty-Five Client Sites
Reading two headers is thirty seconds on one site and an afternoon on a client list, which is why most agencies have never checked. The state also drifts: a plugin update, a new cookie or a page rule change can move a site from answering to forwarding without anybody noticing.
xSpeed Cache, which is ours, ships a Cloudflare panel that purges the edge whenever it purges itself, sets the zone cache level and browser TTL from inside WordPress, and can turn on APO, which is Cloudflare’s own documented route to caching HTML at the edge. The setup is in How to connect Cloudflare, and the asset-rewriting route for a pull-zone CDN is in How to serve assets from a CDN. The full capability grid against eight competing plugins is in the 80-capability comparison, and what sits behind the paid line is on the pricing page. For a fleet, xSpeed Hub reads every connected site through one connection, and agencies running client work will find that shape in our agency use cases.
The rung below the edge is the origin. 32.1% of the 585 CDN sites in this archive still take over 400ms to first byte, at a median of 801.5ms, and 81 of those are returning a cache hit while doing it, which is a hosting result rather than a caching one. For that shape we recommend xCloud, managed hosting built by the same group as xSpeed, since a cache can only be as quick as the server behind a miss.
Common Mistakes Site Owners Make With a CDN
- 🚩 Treating the DNS change as the deliverable. Orange-clouding a domain gets you TLS, a WAF and Brotli. It does not get you HTML at the edge, and 59.4% of the Cloudflare sites here stopped at that point.
- 🚩 Benchmarking a CDN with a one-location lab test. The metric a CDN moves is distance, and a lab test has one distance in it. Our own lab LCP ranks the answering rung last of three.
- 🚩 Buying a CDN to fix a heavy page. Transfer weight correlates with mobile LCP at +0.710 and CDN presence at −0.040. A 4MB page is slow everywhere.
- 🚩 Reading
cf-cache-status: BYPASSas broken. A logged-in response, a cart page or ano-storeheader should bypass. Check the header on a page a stranger sees.
Frequently Asked Questions
I turned on Cloudflare and my PageSpeed score did not change. Did it do anything?
Probably yes to your first byte and no to your score. Check cf-cache-status first. If it says DYNAMIC the edge is forwarding, which is the documented default for HTML, and the 29ms median gain in this dataset is roughly what you got. If it says HIT, the gain is real and your lab score is the wrong instrument to see it in.
My TTFB got worse after adding a CDN. Is that possible?
It is common enough to show up in the aggregate. Only 25.2% of forwarding-edge sites here answer within 200ms against 36.4% of sites with no CDN, because a forwarding edge adds a hop and returns nothing for it. Either get the edge to cache HTML or take it out of the path for the document.
How do I tell an edge hit from my plugin’s cache hit?
Read both headers in one response. cf-cache-status describes Cloudflare, and x-cache, x-litespeed-cache or your plugin’s own header describes your origin. Our guide to checking whether caching works lists the headers WordPress core itself accepts as proof and the six that prove nothing.
Is a CDN worth it if my visitors are all in one country?
Less than the marketing implies, and the compression is still free. A CDN’s measurable return in this dataset is concentrated in distance, and a single-country audience has less of it to save. The TTFB figures here are probed from Lithuania, so they are a long-distance reading by construction.
My scan says a CDN was detected but I never set one up. What is that?
Most often a host that fronts every site with Cloudflare or Varnish by default, or a security proxy somebody added years ago. It also runs the other way: 21.2% of the sites here with no CDN name still carry an edge fingerprint, so a header-reading detector produces both false negatives and surprises.
Does a CDN help Core Web Vitals other than LCP?
Not in this data. Field INP is 142.5ms on CDN sites against 130ms without, and median field CLS is 0.00 in both groups. Neither metric is decided by the network.
I have no CrUX data, so how do I prove the CDN helped?
You cannot prove the LCP part, and the honest move is to stop claiming it. Measure the first byte, which you can read in one request, and accept that the real-user number needs a visitor volume you do not have yet.
Should I use Cloudflare APO or my caching plugin?
Both, in that order of scope. A page cache removes PHP and the database from the response, and APO removes the trip to your server. They act on different parts of the wait, and the ladder above shows the second one is worth 298ms of median TTFB once the first is in place.
My edge cache serves logged-in users the wrong page. Where did I break it?
Almost certainly a cache-everything rule that ignores the session cookie. HTML at the edge is safe only when the rule excludes the cookies WordPress and WooCommerce set, which is what APO handles and what a hand-rolled page rule usually does not.
Is Cloudflare the only realistic option for WordPress?
It is 95.0% of what we detect, which makes it the default rather than the only one. Bunny, Fastly and a pull-zone CDN wired to asset URLs all work, and the last of those is the cheapest way to move images and fonts off the origin without touching the document.
Conclusion: Which Rung Should You Be Aiming At?
| Your goal | Target rung | The measurement that confirms it |
|---|---|---|
| Fastest realistic first byte | CDN present, edge answers | cf-cache-status: HIT, TTFB under 200ms |
| Better Core Web Vitals | Neither, fix bytes | Mobile transfer weight under 1,000KB |
| Global audience, heavy origin | Edge answers, plus hosting | TTFB from more than one region |
Two thirds of WordPress has no CDN. Of the third that does, three in five have one that watches every request travel past it to the origin. The difference between those two states is 298ms of median first byte and 28.7 points of real-user LCP failure, and it costs nothing but reading a response header and turning on the right switch.
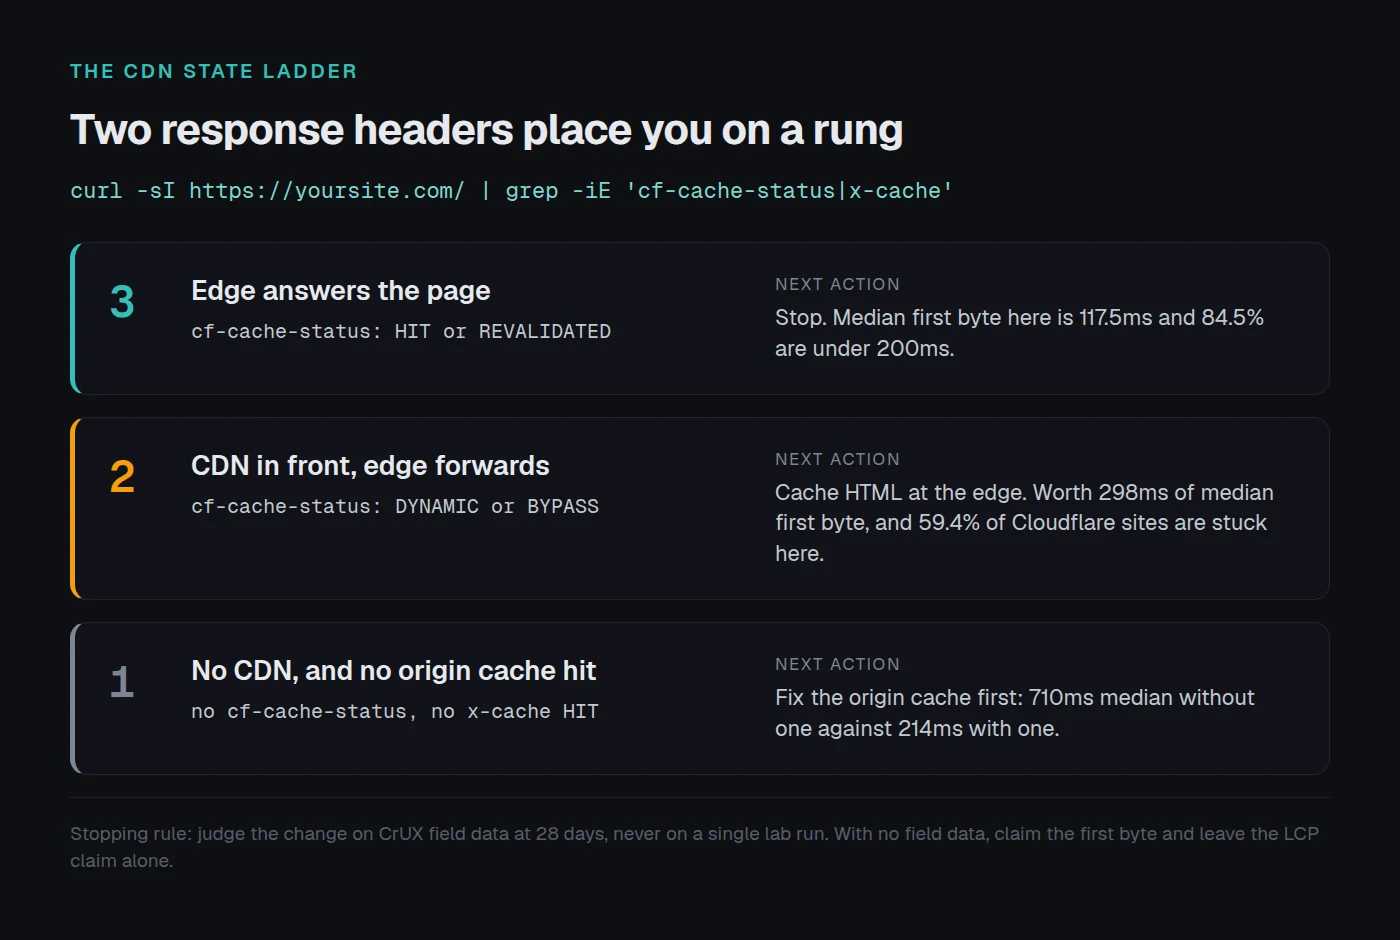
What to do this week:
- Run
curl -sI https://yoursite.com/ | grep -iE 'cf-cache-status|x-cache'and write down which rung you are on. - If the edge is forwarding, turn on HTML caching at the edge and re-read the header to confirm it took.
- If your origin has no cache hit, fix that before the edge, because a forwarding CDN cannot hide a slow server.
- Note today’s CrUX LCP and check it again in 28 days.
- Scan the site first so all three signals are in one place. xSpeed Cache is free to start, Pro runs from $29 a year at the founding price with a 14-day money-back guarantee, and the Cloudflare panel is the switch this post is about.
If you run this on your own site and land somewhere the ladder does not predict, we want the header dump. The 29ms figure is a median across 330 sites, and the interesting cases are the ones that argue with it.