How to Check Whether WordPress Caching Is Actually Working
Updated September 2026
WordPress has shipped its own page cache test since version 6.1, and reading the core source on 8 September 2026 it accepts fourteen response headers as proof of caching, six of which prove nothing of the kind. LiteSpeed Cache sits on 7,000,000+ sites, per the WordPress.org Plugin API on the same date, and on most of them nobody has ever checked.
The question people ask is whether the caching plugin is working. The more useful question is narrower and answerable in thirty seconds: did this page, on this request, come out of a cache, and which layer handed it over? Below are four checks that answer it, what each can and cannot see, and how to read them when they conflict. Every step works with any caching plugin, and none of it requires buying anything.
Quick summary: which check answers which question
| If you want to know… | Do this | Why it is the right tool |
|---|---|---|
| Is this URL served from cache right now | Read the cache status response header | The layer that served it writes the verdict itself |
| Does WordPress believe a page cache exists | Tools → Site Health → Status → Page cache | Built in, but it answers a looser question |
| What a real visitor gets, through the CDN | An external scan from outside your server | Loopback tests and logged-in browsing both lie |
| Why one page keeps missing | Check exclusions, cookies and login state | Most permanent misses are configured |
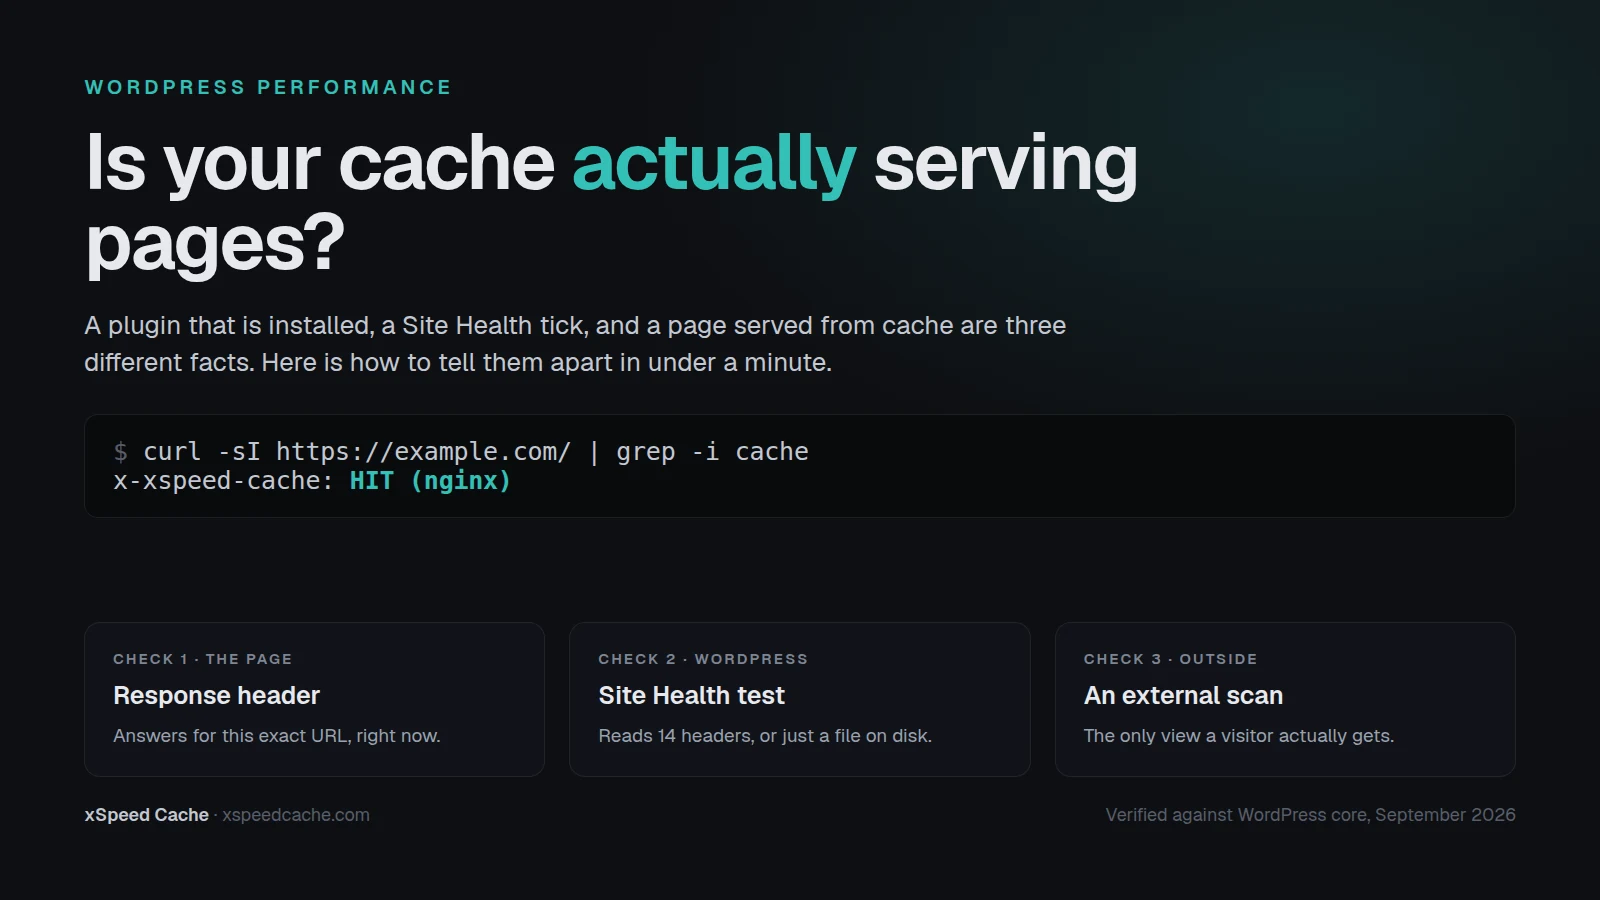
The thirty-second check: read the response header
Ask the page itself.
curl -sI https://your-site.com/ | grep -i cacheIn a browser: DevTools → Network, reload, click the document request, read Response Headers.
You want a status header, whose value is a verdict rather than a duration. HIT means a lookup succeeded and a stored copy came back. MISS means the page was built for this request.
| Header | Written by | A hit looks like |
|---|---|---|
x-litespeed-cache | LiteSpeed Web Server | hit |
cf-cache-status | Cloudflare | HIT |
x-cache | Fastly, Varnish, many CDNs | HIT |
x-cache-status | nginx proxy_cache | HIT |
x-proxy-cache | nginx and several hosts | HIT |
x-srcache-fetch-status | OpenResty srcache | HIT |
That list comes from WP_Site_Health::get_page_cache_headers() in WordPress core, which cites each header against its vendor’s specification. LiteSpeed’s developer guide states that X-LiteSpeed-Cache “is inserted by LiteSpeed Web Server when it serves from cache”, and that a miss value “means that the content has not been served from cache this time, but cache object creation has been initiated.”
Now the part that trips people up.
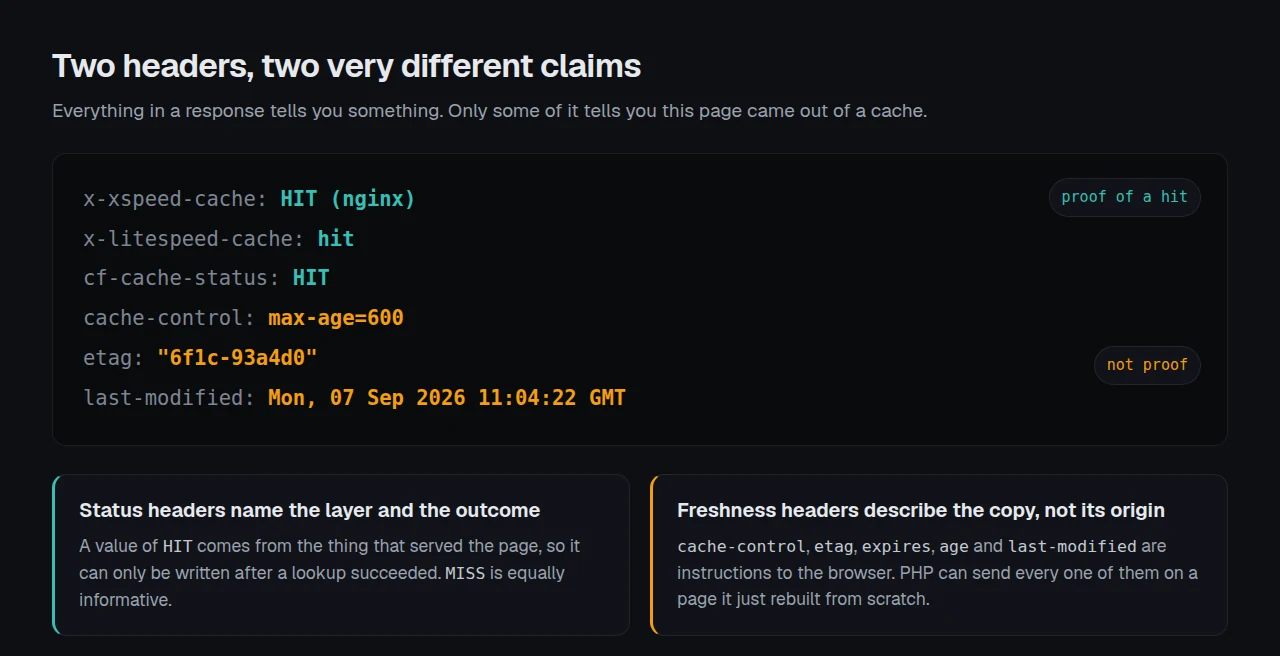
cache-control, expires, etag, last-modified, age and via are freshness and validation headers, telling a browser how long to keep a copy. PHP can send all six on a page it rebuilt a millisecond earlier, and a reverse proxy can add them to anything passing through. They tell you the response is cacheable, never that it was cached.
What the Site Health page cache test actually measures
Go to Tools → Site Health → Status and find Page cache. It is useful, and worth understanding before you trust a green tick.
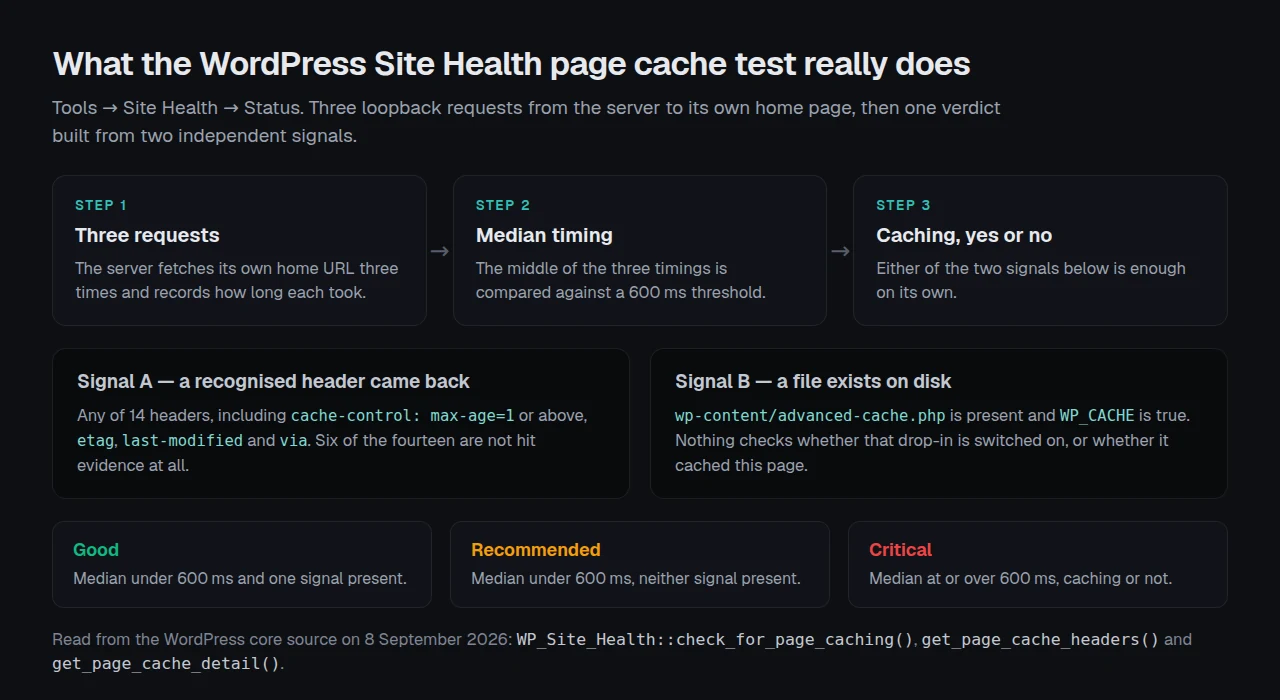
Reading the core source on 8 September 2026, check_for_page_caching() fires three requests from your server to its own home URL and collects recognised headers. get_page_cache_detail() takes the median timing and decides:
$has_page_caching = ( count( $headers ) > 0 || $page_cache_detail['advanced_cache_present'] );Either signal is enough on its own, and advanced_cache_present is a file check: wp-content/advanced-cache.php exists and WP_CACHE is true. Nothing asks whether that drop-in is switched on, whether caching is enabled inside the plugin that installed it, or whether this page was cached.
The threshold is 600ms, per get_good_response_time_threshold(), which core documents as based on web.dev’s Time to First Byte guidance.
| Site Health says | What it proves | What it does not prove |
|---|---|---|
| Good | The home page answered under 600ms and something cache-shaped was found | That any page other than the home page is cached |
| Recommended | The home page is fast, no caching signal seen | That caching is off, since a CDN sits outside this test |
| Critical | The median loopback took 600ms or more | Anything about caching, since this verdict ignores it |
So a site with a deactivated cache plugin that left advanced-cache.php behind reports Good, and a site whose cache works but whose database is slow reports Critical. Both are the test working as written.
The footprint comment, and why it vanishes
Several plugins append a signature to the HTML. Most tutorials lead with this check, and it is the one most often missing for an innocent reason.
- WP Super Cache. Its readme says to view the source for “Cached page generated by WP-Super-Cache on YYYY-MM-DD HH:MM:SS”, and adds the detail that matters: “On reload, a cached page will show the same timestamp so wait a few seconds before checking.”
- WP Fastest Cache. Its FAQ says to refresh twice and look for
<!-- WP Fastest Cache file was created in 0.330816984177 seconds, on 08-01-14 9:01:35 -->.
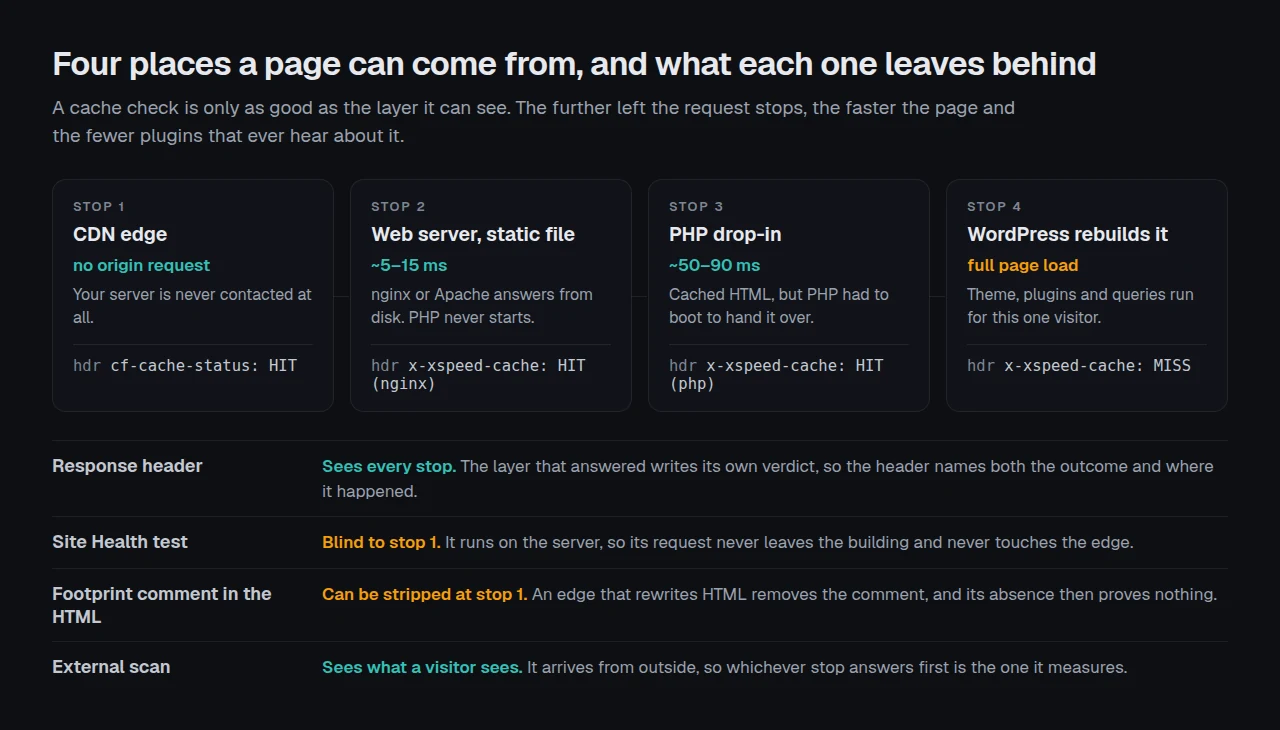
WP-Optimize’s FAQ carries the warning all of these need: “Cloudflare will strip out the special HTML comment at the bottom of the source of a page that is helpful to confirm that page caching is working, so, don’t be confused by that, it’s absence doesn’t indicate the cache is not working.”
An absent footprint proves nothing. A present one, with a timestamp frozen across reloads, is solid evidence.
Checking from outside the server
Everything above runs on your machine or your server. A visitor’s request arrives from elsewhere and may never reach your origin.
The outside view is what our free xSpeed Scan exists for, and xSpeed is ours: we build it at WPDeveloper alongside the cache plugin. Three of its checks answer this question. D2, “page served from cache”, reports the cache evidence in the live response, and when a page correctly opts out it says so rather than failing you: a response marked no-cache, no-store, must-revalidate comes back as “correctly per-visitor”. D1, “time to first byte”, prints the measured TTFB and the region it came from, so you can see how much is distance. W2 names the caching plugin found in the response, which is how people learn the plugin they removed is still answering.
If you would rather check by hand, the manual equivalent is two timed requests to the same URL:
curl -s -o /dev/null -w 'TTFB %{time_starttransfer}s\n' https://your-site.com/some-post/
curl -s -o /dev/null -w 'TTFB %{time_starttransfer}s\n' https://your-site.com/some-post/
A working page cache makes the second request much faster, then keeps both fast. Two slow requests in a row on a page that should be cached sends you back to the header check. Do not expect the Lighthouse score to follow: across 958 sites we scanned this month, caching cut median TTFB by 73% and left LCP where it was.
Run the free scan on your own site: xspeedcache.com/scan/
Anyone running xSpeed Cache can skip the header lookup: x-xspeed-cache names the layer as well as the outcome, HIT (nginx) for a static file served before PHP starts, HIT (php) for the drop-in fallback, MISS for a rebuild, and the plugin adds its own Site Health check. The cache HITs and MISSes guide has the full reading. That distinction earns its keep, because “cached” and “cached before PHP boots” are different speeds, and it is the split that decides what LiteSpeed Cache does on Nginx or Apache.
Checking a fleet rather than a page
One site is a terminal command. Twenty-five client sites is a spreadsheet nobody updates. xSpeed Hub is ours too, and it reports cache status, hit ratio and cached-page counts for every connected site in one place, free on the free tier; its MCP server lets an AI assistant run these checks on demand. For what each plugin exposes to a fleet check, the 80-capability comparison records which tier every feature ships in.
When the checks disagree: five ordinary reasons
| Symptom | Usual cause | What to do |
|---|---|---|
MISS on every single request | You are logged in | Test in a private window or with curl |
Site Health Good, header says MISS | A stale advanced-cache.php | Confirm caching is enabled inside the plugin |
| Footprint absent, TTFB fast | A CDN rewrote the HTML | Trust the header and the timing instead |
| One URL misses, the rest hit | An exclusion rule matches it | Review your cache exclusions |
| Cart and checkout always miss | Correct, by design | Leave it, and read the checkout guide |
That last row bears stating plainly: a WooCommerce store whose checkout is being cached has a bug, not a win.
Frequently Asked Questions
Site Health says my page cache is working, but the site still feels slow. What now?
Site Health tested your home page from the server itself. Test a real post from outside, read its cache status header, and check the TTFB. A slow site with a working cache usually has an asset or database problem instead.
I get a MISS on every reload. What am I doing wrong?
Check whether you are logged in, since almost every plugin serves logged-in users uncached pages. If a private window also misses, check your exclusion rules, then whether a plugin cookie is forcing a bypass.
My header says HIT (php) instead of HIT (nginx). Is that a problem?
It works, and it is slower than it needs to be. The PHP path serves cached HTML after PHP has booted; the static path answers before PHP starts. In xSpeed Cache it usually means the server-level rewrite rule is not active yet.
I cannot find the footprint comment in my page source even though caching is on.
Expected behaviour behind a CDN, as WP-Optimize’s own FAQ documents. Use the response header instead, which an edge cannot remove without adding its own.
The scan says my page is not cached, but my dashboard shows a 90% hit ratio.
A hit ratio averages many URLs over many hours. A scan is one request to one URL, possibly the first after a purge. Reload the URL once, then scan again.
Which header should I look for if I do not know what my host runs?
Grep for the word rather than guessing a name: curl -sI https://your-site.com/ | grep -i cache returns every candidate, one per line.
I purged the cache and now every page is a MISS. Should I worry?
No. A purge empties the store, so the next visitor to each URL rebuilds it. Reload once and the second response should be a hit. A preloader shortens that window by warming pages for you.
Can two caching plugins both be working at once?
They can both be installed and both write footprints, which is how stale HTML and conflicting copies happen. Run one page cache. If a scan reports a plugin you thought you removed, its drop-in is probably still in place.
How do I check a page other than the home page?
Point the same curl command at any post or archive URL. Home pages are often excluded or handled separately, so testing only the home page is how a broken post cache hides.
Does a CDN mean I do not need a page cache?
No. A CDN still fetches from your origin on a miss or an expiry, and that origin request is what the page cache answers. cf-cache-status: MISS alongside a fast TTFB is a healthy pair.
What to do this week
- Run
curl -sIon your home page and on one real post, and note which cache status header came back on each. - Open Tools → Site Health → Status, read the Page cache result, and treat it as a hint, not a verdict.
- Scan the same post from outside and compare check D1 against your own timing, so you know how much of the TTFB is distance.
- Fix whatever the three disagree about, then run all three again.
- If you have no page cache, or one whose status you cannot see, xSpeed Cache is free on WordPress.org and reports its own hit or miss on every request. Paid tiers start at $29 a year at the founding price with a 14-day money-back guarantee, and its migration tool imports settings from WP Rocket, W3 Total Cache or WP Super Cache if you already have one configured.
None of these checks asks you to take a dashboard’s word for it. The page itself will tell you, on every request, if you ask.