The 350 KB Cliff: Where Page Weight Starts Deciding Mobile LCP on 912 WordPress Sites in 2026
Updated September 2026
Across 912 WordPress sites we measured on 27 September 2026, transfer weight tracks mobile Largest Contentful Paint at a Spearman rho of +0.706. The server’s response time, measured by our own probe on the same 912 sites, tracks it at minus 0.021, which is no relationship at all. Google’s guidance, per web.dev’s LCP reference, is that a page should render its largest element in 2.5 seconds or less at the 75th percentile. The comparison people expect here is caching against no caching. The more useful comparison is bytes against everything else, because bytes is the only input on that list a site owner controls directly and the only one that moves the number. This post publishes the curve, the weight where it turns, and the four things it cannot tell you.
Quick Summary: Which Weight Target Is Actually Worth Hitting
| If you want… | Do this | Why |
|---|---|---|
| A realistic chance of passing LCP | Get mobile transfer weight under 250 KB | 88.6% of the 44 sites under 250 KB pass the 2.5s threshold |
| A coin flip | Get under 500 KB | 55.4% of the 92 sites under 500 KB pass |
| To satisfy our own scan’s weight check | Get under 1.5 MB | And still fail LCP 78.7% of the time, which is why this row is a warning |
| To know which problem you have | Compute LCP − FCP as a share of LCP | Above ~45% you are weight-bound; below it your critical path is the problem |
| To stop guessing | Run the free xSpeed Scan and read the mobile view | The top-level report is the desktop view, and Google ranks on mobile |
The Method, and the Four Things It Cannot Tell You
The limitations come first, because a reader who does not know how far to trust a number cannot use it.
Every scan our public scanner runs is kept as a report at /scan/r/<id> and served as JSON at /api/scan/<id>. On 27 September 2026 the archive held 2,647 reports on 2,647 distinct hosts, of which 1,702 are WordPress. Each report grades the same URL twice, on a simulated mobile device and on desktop, and each device view carries a Lighthouse total transfer size alongside its own LCP. 912 WordPress hosts carry both numbers on the mobile view, and those 912 are this study, scanned between 19 and 27 September 2026, 884 of them on the current rubric version 2026.09.5.
Four limitations, each of which changes how you should read what follows.
- This is observational, not a controlled test. Nobody cut bytes from a site and watched LCP fall. A correlation of +0.706 is a strong association, not a demonstrated mechanism.
- One URL per host. The scanner grades the page it was given, usually a home page, which says nothing about the archive template behind it.
- Lab mobile, not your visitors. Lighthouse runs a throttled mobile profile. Real-user field data appears later for the 178 sites that have it, agreeing on direction and disagreeing on magnitude.
- Weight is measured as transferred, not as stored. A 2 MB image served as 180 KB of WebP counts as 180 KB. Compression is already priced in, which is what makes the remaining bytes interesting.
One convention: our scanner prints megabytes as 1,048,576 bytes and this post follows it, so its evidence text and these figures are the same number. The weight check A5 prints reproduces the raw byte count to one decimal place on 912 of 912 sites.
The Curve, and the Step Where It Breaks
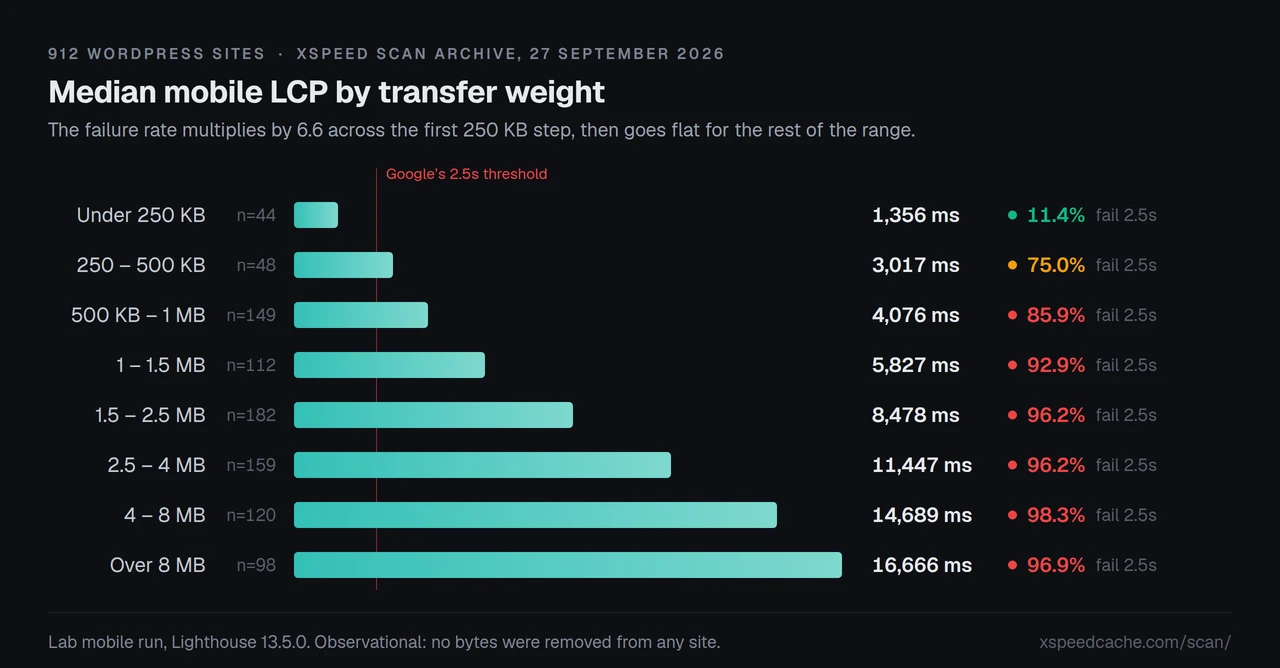
Median mobile transfer weight across the 912 is 1.9 MB, and the distribution is long-tailed: 482 KB at the 10th percentile, 3.67 MB at the 75th, 7.82 MB at the 90th, one site at 62.5 MB. 89.9% of these pages are over 500 KB and 61.3% are over 1.5 MB.
| Mobile transfer weight | Sites | Median mobile LCP | Fail 2.5s | Median asset score |
|---|---|---|---|---|
| Under 250 KB | 44 | 1,356 ms | 11.4% | 69 |
| 250 – 500 KB | 48 | 3,017 ms | 75.0% | 63 |
| 500 KB – 1 MB | 149 | 4,076 ms | 85.9% | 50 |
| 1 – 1.5 MB | 112 | 5,827 ms | 92.9% | 45 |
| 1.5 – 2.5 MB | 182 | 8,478 ms | 96.2% | 34 |
| 2.5 – 4 MB | 159 | 11,447 ms | 96.2% | 28 |
| 4 – 8 MB | 120 | 14,689 ms | 98.3% | 20 |
| Over 8 MB | 98 | 16,666 ms | 96.9% | 16 |
Read the first two rows again. One 250 KB step multiplies the failure rate by 6.6. Nothing else in the table comes close: from 1.5 MB upward the curve is flat, wandering between 92.9% and 98.3% while weight grows sixteen-fold.
To locate the turn without letting bin edges choose it, we sorted all 912 sites by weight and walked an 80-site window along them. The window median crosses 2.5 seconds between 194 KB, where median LCP is 2,120 ms and 40% of the window fails, and 347 KB, where median LCP is 2,670 ms and 60% fails. That is the cliff, at roughly 350 KB rather than any round number a plugin dashboard shows you.
Our Own Scan’s Weight Check Passes Sites That Fail Google
Check A5 in our rubric is “Total page weight ≤ 1.5MB”, worth 3 points of a 20-point asset dimension. On this population it does not separate the outcome it exists to predict.
375 of the 912 sites pass check A5. 295 of them, 78.7%, fail the 2.5-second LCP threshold on the same report. A reader who fixes what our scan flags and stops when the weight row turns green has a four-in-five chance of still failing the metric Google ranks on. The threshold sits where the curve has already flattened: on the evidence above it belongs near 350 KB, or on a sliding scale rather than a single line. We publish that because it is ours to fix, and the narrower version is worse: embedpress.com, one of our own plugin sites, passes check A5 at 1,101 KB and still records a mobile LCP of 8,067 ms.
Why Weight Decides: The Bytes Arrive After the First Paint
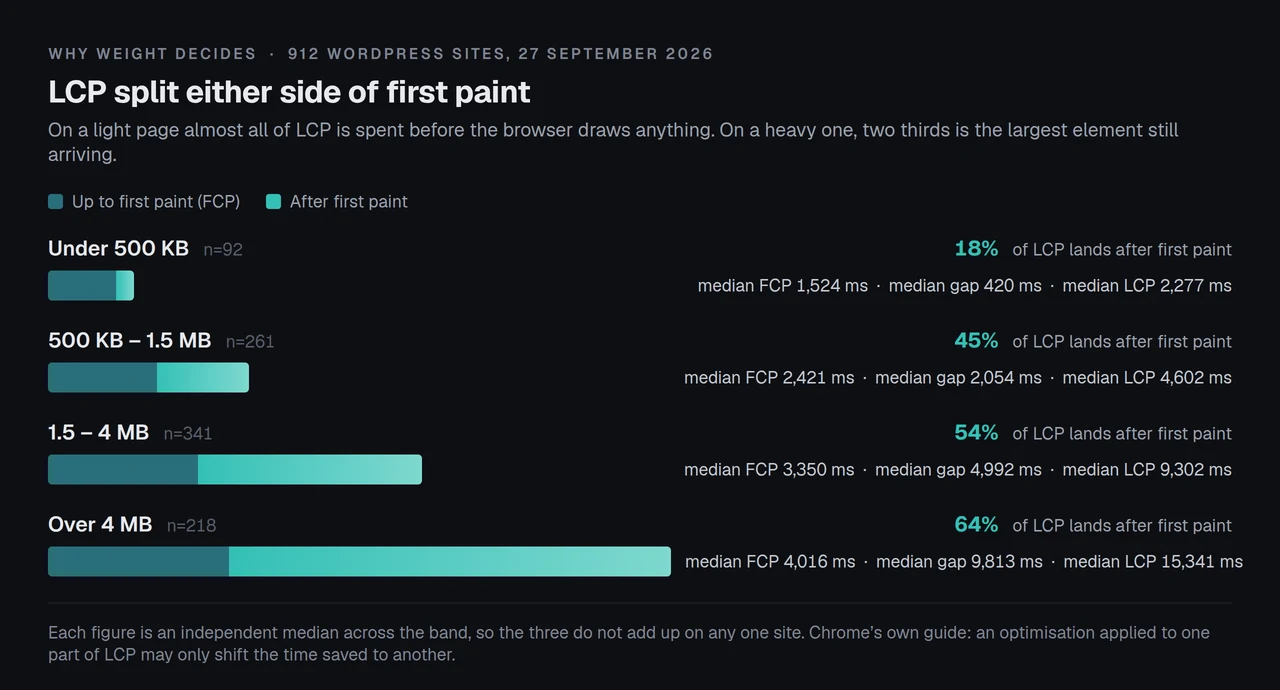
Chrome’s own optimisation guide splits LCP into four consecutive parts: time to first byte, resource load delay, resource load duration, and element render delay. Per Chrome’s “Optimize LCP” documentation, they “add up to the full LCP time” with no overlap. The archive cannot see all four, but it can see the split either side of first paint, and that is where the mechanism shows up.
| Mobile transfer weight | Sites | Median FCP | Median LCP | Median per-site gap | Gap as share of LCP |
|---|---|---|---|---|---|
| Under 500 KB | 92 | 1,524 ms | 2,277 ms | 420 ms | 18% |
| 500 KB – 1.5 MB | 261 | 2,421 ms | 4,602 ms | 2,054 ms | 45% |
| 1.5 – 4 MB | 341 | 3,350 ms | 9,302 ms | 4,992 ms | 54% |
| Over 4 MB | 218 | 4,016 ms | 15,341 ms | 9,813 ms | 64% |
Each column there is an independent median, so they do not subtract on any single site. On a light page 82% of LCP has already elapsed by first paint, so the remaining problem is whatever delayed that paint. Over 4 MB the position inverts: two thirds of LCP happens after the browser has drawn something, which is the largest element still arriving. That is also why the curve flattens. The same Chrome guide says it plainly: “an optimization applied to one part won’t improve LCP, it will just shift the time saved to another part.” Past 4 MB, removing a megabyte moves a page from hopeless to hopeless.
Our 93% study of slow WordPress sites reached the same place from the server side: it subtracted the entire measured server response from LCP, and 93.4% of failing sites still failed. Here the server response correlates with LCP at +0.032 and the probe TTFB at −0.021. Two methods, one answer.
What Predicts Mobile LCP, Ranked
| Input | Sites | Spearman rho | Can a site owner change it directly? |
|---|---|---|---|
| Total transfer weight | 912 | +0.706 | ✅ |
| First Contentful Paint | 912 | +0.687 | ➖ |
| Speed Index | 912 | +0.685 | ➖ |
| Asset dimension score | 912 | −0.656 | ✅ |
| Total Blocking Time | 912 | +0.483 | ✅ |
| Delivery dimension score | 912 | −0.114 | ✅ |
| Lighthouse server response | 912 | +0.032 | ✅ |
| Probe TTFB | 912 | −0.021 | ✅ |
First Contentful Paint and Speed Index are marked ➖ because they are outcomes rather than levers: two more paint timings, not something you edit. Among the inputs a person can change, transfer weight wins, the asset score comes second, JavaScript blocking time third, and the two server measurements are indistinguishable from noise.
The Weight Cliff Test
The framework this post contributes. Five steps, one scan, and one number that tells you which half of the problem you have.
- Measure on the device that decides. Run the scan and open the mobile view, not the top-level score. Our own report’s headline numbers are the desktop run, a trap our lab-versus-field study documented in detail. Median weight was within 3% between devices here (1,950 KB mobile against 2,021 KB desktop), so mobile responsive images are saving almost nothing at population scale.
- Place yourself on the curve. Find your band in the table above and read the failure rate. That is your prior before you change anything.
- Split your LCP at first paint. Compute
(LCP − FCP) / LCP. Above roughly 45% you are weight-bound and step 4 applies. Below it, bytes are not your problem and step 5 is. - Set the target from the curve, not from a round number. Getting under 1.5 MB buys a 22.7% pass rate. Under 500 KB buys 55.4%. Under 250 KB buys 88.6%. Pick the pass rate you want and read off the weight.
- If you are already light and still failing, stop cutting bytes. The next section is about you.
What this test cannot do. It gives a probability drawn from other people’s sites, not a prediction about yours, and it inherits the instability of a single lab run, which the repeat measurements below quantify rather than wave away.
The 41 Light Pages That Fail Anyway
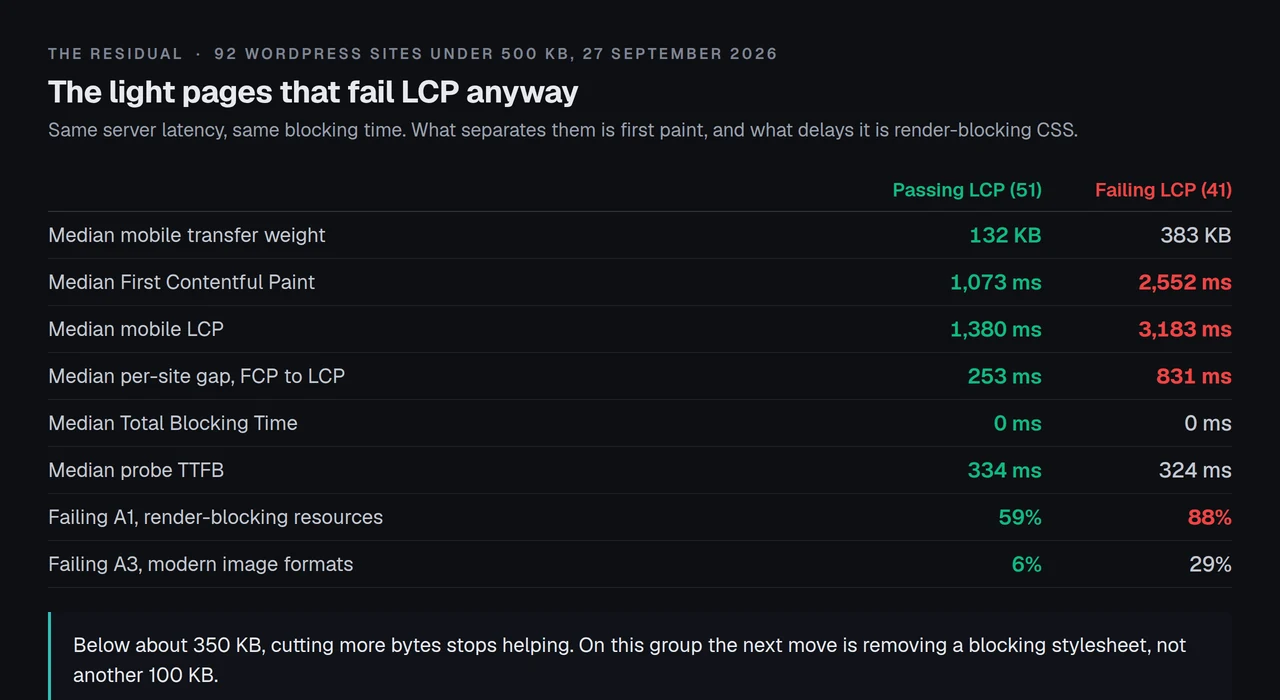
Of the 92 sites under 500 KB, 41 still fail LCP. If weight were the whole story that number would be near zero, which makes the 41 the most informative group here.
| Measure | Light and passing (51) | Light and failing (41) |
|---|---|---|
| Median mobile transfer weight | 132 KB | 383 KB |
| Median FCP | 1,073 ms | 2,552 ms |
| Median LCP | 1,380 ms | 3,183 ms |
| Median gap from FCP to LCP | 253 ms | 831 ms |
| Median Total Blocking Time | 0 ms | 0 ms |
| Median probe TTFB | 334 ms | 324 ms |
| Failing check A1, render-blocking resources | 59% | 88% |
| Failing check A3, modern image formats | 6% | 29% |
The two groups share their server latency and their blocking time. What separates them is first paint, 1.5 seconds later on the failing group, and render-blocking resources, which 88% of them fail against 59%. These sites are not heavy. Their critical path is serialised: stylesheets and fonts stand in front of the first pixel. Cutting another 100 KB from a 383 KB page will not fix that. Removing one blocking stylesheet might.
Google’s Field Data Agrees on Direction and Argues About Size
Every report also carries Chrome User Experience Report values for that origin where Google publishes them. 178 of the 912 have both a mobile transfer weight and a real-user LCP, and they are the only honest check on everything above, because CrUX is what ranking uses.
| Mobile transfer weight | Sites | Median field LCP | Fail 2.5s in the field |
|---|---|---|---|
| Under 500 KB | 10 | 1,408 ms | 10.0% |
| 500 KB – 1 MB | 24 | 2,228 ms | 41.7% |
| 1 – 1.5 MB | 17 | 2,641 ms | 52.9% |
| 1.5 – 2.5 MB | 30 | 2,056 ms | 36.7% |
| 2.5 – 4 MB | 29 | 3,013 ms | 65.5% |
| Over 4 MB | 68 | 3,112 ms | 67.6% |
The ends behave. The middle does not: the 1.5 to 2.5 MB row sits below the row beneath it, on 30 sites, and we are not going to explain that away. At this sample size two sites moving shifts a cell several points. The direction survives and the monotonicity does not.
Two numbers from the same 178 sites matter more than the table. Transfer weight tracks field LCP at +0.322. Our own lab mobile LCP tracks field LCP at +0.261. The transfer weight of a page predicts what Google’s real users experience slightly better than the lab LCP printed on our own report does. That is an uncomfortable finding about our own instrument and it is the strongest argument in this post for treating bytes as the number to manage. Real-user LCP fails on 53.9% of the 178 against 89.3% in the lab, so the lab number is pessimistic in absolute terms while ordering the same sites roughly the same way.
Repeat the Measurement and Weight Barely Moves
A single lab run wobbles. The question for this study is whether transfer weight wobbles as much, because a predictor less stable than the thing it predicts is useless.
Report pages carry a scan-history table linking every prior report for that host, a free repeat-measurement dataset. Following it gives 450 scan pairs across 179 of the study hosts, each pair two independent measurements of the same URL.
| Measured twice on the same URL | Transfer weight | Mobile LCP |
|---|---|---|
| Median absolute change | 3.8% | 13.6% |
| Reproduced within 10% | 60.0% | 43.8% |
| Same category on both scans | 75.6% of weight bands | 93.1% of pass/fail verdicts |
Weight moves about a quarter as much as the metric it predicts. The curve itself also reproduces on the 450 prior scans alone, an independent set of measurements: 30.2% fail under 500 KB, 80.5% to 1 MB, 94.8% to 1.5 MB, 100.0% to 4 MB, 99.0% above it. Same shape, same cliff, different scans.
The caveat on the face of this, stated plainly: the median gap between paired scans is 0.03 days, about 43 minutes, with a maximum of 7.2 days. This measures instrument reproducibility, not whether a site’s weight is stable across a month. It is an upper bound.
Sorting a Client Fleet Into Two Piles
At one site this is a scan and a subtraction. At twenty-five it is triage: the same three questions, in the same order, on every site.
- Mobile transfer weight, first, because it is the most reproducible of the three.
- The after-paint share of LCP, which sorts the fleet into a weight-bound pile and a critical-path pile.
- Check A1, render-blocking resources, read on the critical-path pile. WooCommerce stores skew heavy on product templates and land in the other one.
We build xSpeed Cache at WPDeveloper, a Startise company, and it is ours. Its minification, image conversion and lazy-loading modules move bytes; its page cache moves the server number this dataset says was never the problem. A direct wordpress.org Plugin API query on 27 September 2026 returns version 1.3.5, 8,000+ active installs and a 5.0 rating from 14 ratings. Being explicit about which module touches which half is the point of publishing the correlation table above. The 80-capability comparison sets each module against eight competing plugins, and browser cache settings is where repeat-visit weight goes to zero, which the first-load figures here exclude.
Hosting is the other half, and on this evidence it is the smaller half for LCP. We recommend xCloud for it, and it is ours: xCloud and WPDeveloper are both Startise companies. It gives the cache an origin tuned for it. What it will not do, given the +0.032 correlation above, is rescue a 4 MB page.
Run the free scan on your own site: xspeedcache.com/scan/
Common Mistakes Site Owners Make Reading Page Weight
- Reading the desktop number. The top-level score on most speed reports, ours included, is the desktop run. Google ranks on mobile field data.
- Aiming at 1.5 MB or 2 MB. Both are past the cliff. On this population, under 1.5 MB is a 22.7% pass rate.
- Cutting bytes on a page that is already light. 41 of the 92 sub-500 KB sites fail LCP, and their problem is render-blocking, not size.
- Converting formats and stopping there. Our WebP measurement found format conversion saved a median 38.4% while resizing the same files saved 92.8%. Dimensions beat format.
- Treating the asset score as the target. It correlates at −0.656 and is a composite. Weight is the input you can actually edit.
- Expecting a cache to fix it. Sites with a caching plugin in this archive have a median mobile LCP of 6,897 ms against 6,442 ms for sites without one. That difference is not a benefit, and our headroom analysis explains why the two questions are separate.
Where Our Own Sites Land, Named
If the data makes us look bad, it gets published under the same caveats as everyone else’s. Eleven WordPress properties belonging to WPDeveloper or Startise are in the 912, and most sit on the wrong side of the cliff. The eight heaviest:
| Our site | Mobile weight | Mobile LCP | Check A5 | Grade |
|---|---|---|---|---|
betterdocs.co | 50.0 MB | 34,501 ms | ❌ | F |
essential-addons.com | 8.0 MB | 8,851 ms | ❌ | F |
essential-blocks.com | 6.8 MB | 12,001 ms | ❌ | F |
sslcommerz.com | 5.3 MB | 12,455 ms | ❌ | F |
wpdeveloper.com | 4.2 MB | 8,959 ms | ❌ | F |
easy.jobs | 4.0 MB | 12,751 ms | ❌ | F |
startise.com | 2.5 MB | 12,301 ms | ➖ | D |
embedpress.com | 1.1 MB | 8,067 ms | ✅ | C |
betterdocs.co is the third-heaviest page in the archive of 912. We are the vendor, these are our sites, and the curve applies to us exactly as it does to everyone in the tables above.
Frequently Asked Questions
My page weight is 1.2 MB and the scan says the weight check passes, so why is my LCP 6 seconds?
Because the check’s threshold is 1.5 MB and the cliff is around 350 KB. Of the 375 sites passing check A5 here, 78.7% fail the 2.5-second LCP threshold on the same report. A passing weight row is not a passing LCP.
I cut my page from 4 MB to 2 MB and LCP barely moved. Did I waste the work?
Not for bandwidth. For LCP, likely yes: failure rates are 96.2% at 2.5 to 4 MB and 96.2% at 1.5 to 2.5 MB, so that cut moved you inside the flat part of the curve. The gains start below about 500 KB.
I got under 300 KB and I am still failing LCP. What now?
Stop cutting and look at render-blocking resources. Among the 41 light-but-failing sites here, 88% fail the render-blocking check against 59% of the light-and-passing group, and their first paint arrives 1.5 seconds later on identical server latency.
Does this mean caching is useless?
No, it means caching and LCP are different problems. Caching moves time to first byte and repeat-visit cost, both real. On this archive the probe TTFB correlates with mobile LCP at −0.021, so it does not move the metric Google ranks on.
My host says my server is fast and my LCP is still bad. Who is wrong?
Probably neither. A fast server and a slow LCP is the normal state in this dataset. The Lighthouse server response time correlates with mobile LCP at +0.032 across 912 sites.
Is 350 KB realistic for a WordPress site with photographs?
It is uncommon: 95.2% of the sites here are over 250 KB. It is reachable if the hero image is sized to its display box rather than uploaded at full resolution.
My mobile weight is higher than my desktop weight. Is that a bug?
It happens on 31.1% of sites measured on both devices, usually because a responsive image set picks a larger source than the layout needs. Median weight differs by about 3% between the two, so responsive images save little at population scale.
Can I trust one scan, given lab scores wobble?
Trust the weight more than the timing. Across 450 repeat measurements the transfer weight changed by a median 3.8% while mobile LCP changed by 13.6%, which is the reason this post treats weight as the number to manage.
Does field data from real users show the same thing?
Directionally yes, less sharply. On the 178 sites with Chrome User Experience Report values, field LCP failure runs from 10.0% under 500 KB to 67.6% over 4 MB, but the middle of the curve is not monotonic and a 30-site cell contradicts the row below it.
Which number should I put on a client report?
Mobile transfer weight, the after-paint share of LCP, and the render-blocking verdict. Those three sort a site into a category and imply the next action, which a single composite score does not.
Conclusion: Bytes or Critical Path?
Page weight is the LCP input a site owner controls and the strongest one measured here, and it stops mattering in both directions: above roughly 1.5 MB the curve is flat, and below about 350 KB the problem stops being bytes at all.
| Your situation | Do this first | Expected payoff |
|---|---|---|
| Over 1.5 MB, after-paint share above 45% | Resize the largest images to their display box | Moves you toward the steep part of the curve |
| 500 KB to 1.5 MB | Keep cutting toward 500 KB, then re-measure | 55% pass rate waits at 500 KB, 22.7% at 1.5 MB |
| Under 500 KB and still failing | Fix render-blocking CSS and fonts | 88% of this group fails that check |
| Fast server, slow LCP | Ignore the server and read your asset list | Server correlates at +0.032 |
| Unsure which you are | Compute (LCP − FCP) / LCP on one scan | One number sorts you in under a minute |
What to do this week: scan your slowest template and open the mobile view, not the headline score. Write down the transfer weight and compute the after-paint share. Above 45%, resize your hero image to the box it renders in and scan again. Below 45%, list every stylesheet and font loading before first paint. For the delivery half without doing it by hand, xSpeed Cache is one of the options worth trying: $29 a year at the founding price, a 14-day money-back guarantee, and 8,000+ active installs as of 27 September 2026.
Every number here came out of a public archive anyone can query, one report at a time, at /api/scan/<id>. If you run the Weight Cliff Test and land somewhere the curve did not predict, that is the interesting case, and the archive is how we would find out why.