The Hit Rate Dropped Overnight and the Cache Never Changed

Updated September 2026
Our own 1.1.4 release notes, dated 9 August 2026, record that Apache and LiteSpeed sites showed a permanent 0% hit ratio because hits were counted only on nginx. W3Techs put those two servers at 22.0% and 14.5% of the web on 22 September 2026. On all of them the number was broken, whatever the cache did.
The question people ask is which setting broke the cache. The more useful question is whether the cache changed at all, because a hit rate has three moving parts and only one is the cache. This covers a page-cache hit ratio reported by a WordPress caching plugin after an update.
Quick summary: what actually moved
| If the number dropped… | Do this | Why |
|---|---|---|
| …the moment you updated, traffic flat | Read the changelog first | A counting change lands on the update boundary |
| …the moment you updated, counted requests moved too | Check what left the denominator | Bots and 404s leaving the count move the ratio, not the cache |
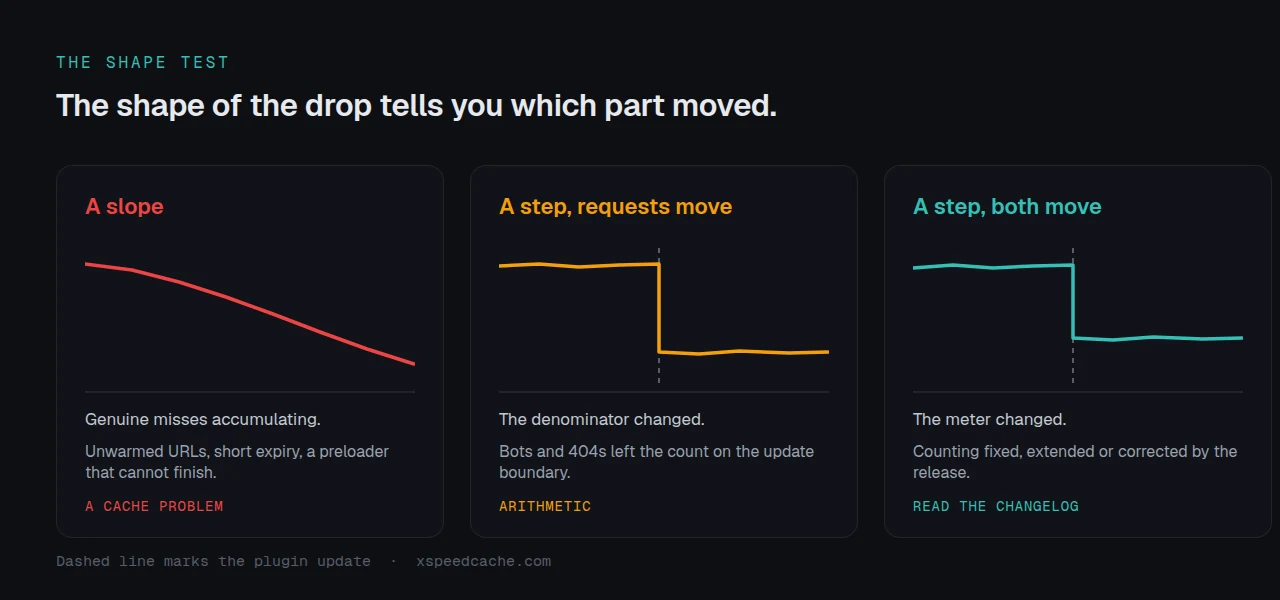
| …gradually over days | Treat it as a real cache problem | Genuine misses accumulate, they do not step |
Jump to: confirm the cache · the fraction · our own meter changes · real drops · FAQ
Confirm the cache still works before you trust the number
Ask for a page twice and read the header on the second request, the only one that can be a hit.
curl -sI https://example.com/ | grep -i -E 'x-xspeed|x-cache|cf-cache-status|age'A hit there means the cache is serving and the dashboard is what changed. Reading these headers has traps, and sixteen headers WordPress core accepts as proof of a page cache covers which six prove nothing. If the second request is a miss, which of the four caches holds the old copy is the faster path.
A hit rate is a fraction with three moving parts
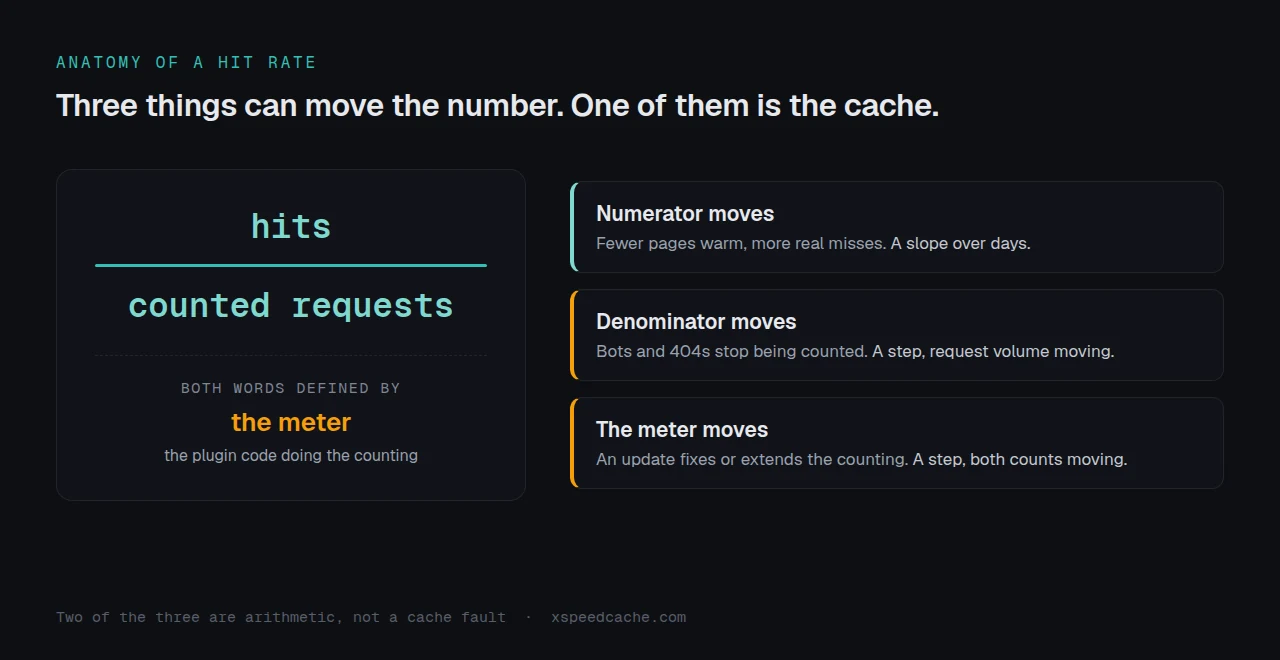
Every hit-rate report is hits divided by countable requests, produced by code that decides what both words mean. An update can move any of the three alone.
| Part | What it is | What an update does to it | Shape on the chart |
|---|---|---|---|
| Numerator | Requests served from cache | Fewer pages warm, more misses | A slope over days |
| Denominator | Requests the plugin counts | Bots, 404s and bypasses reclassified | A step, request volume moving |
| The meter | Code deciding what counts as a hit | Counting fixed, extended or corrected | A step, both counts moving |
The shape test does most of the work. A ratio that fell over a week is a cache problem. One that fell between two page loads either side of an update is arithmetic.
Four times we changed the meter, and what each did to the number
We ship a hit-ratio chart, so our own release history is the clearest public worked example. Every row is from plugins.svn.wordpress.org/xspeed/trunk/changelog.txt, fetched 22 September 2026.
| Release | Date | What changed in the meter |
|---|---|---|
| 1.1.4 | 9 Aug 2026 | Hits counted on every server, not only nginx. Apache and LiteSpeed had shown a permanent 0% |
| 1.1.4 | 9 Aug 2026 | The ratio began excluding 404s and bot traffic |
| 1.1.4 | 9 Aug 2026 | Headers began separating a miss from a deliberate bypass |
| 1.2.3 | 2 Sep 2026 | The dashboard began reporting whether the cache is actually serving, not what the setting says |
Excluding bot traffic removes requests that were mostly served from cache, so a site with heavy crawler traffic sees its ratio fall on upgrade while serving every visitor as before. The number got more honest and looked worse. Read the changelog first: a dated release note costs a minute, a settings audit chasing a counting change costs an afternoon.
When the drop is real: four documented causes
| Cause | Source |
|---|---|
| One POST kept a visitor on the uncached path for the rest of their visit, so a single comment generated every later page from scratch | our 1.1.8, 20 Aug 2026 |
| Cache warming identified itself in a way common firewall rule sets block, so new posts went unwarmed | our 1.3.5, 22 Sep 2026 |
| Cache lifetime set shorter than the preloader interval, leaving pages permanently uncached | our 1.1.1, 28 Jul 2026 |
| Crawlers and preload bots inflating what the cache stores | WP-Optimize 4.6.0, per its readme, 6 Jul 2026 |
Both hit publishers hardest: every new URL starts cold and nothing warms it.
A fifth route belongs to the cache key rather than the meter, and a logged-out visitor seeing someone else’s name covers how a new cookie or query parameter fragments it. If a tracking parameter arrived last week, start there.
The same question across thirty sites
One dashboard shows one site; the pattern across a fleet tells you whether it was the plugin. If a version bump moved the ratio everywhere, it is a counting change and no per-site configuration will move it back. If it moved on four of thirty, those four share something the others do not, usually a firewall, a bot filter or a publishing cadence. xSpeed Hub reads those numbers across every connected site from one place. It is ours, from WPDeveloper, a Startise company.
What is measured rather than estimated depends on your server, and server compatibility lists which is which.
Run the free scan on your own site: xspeedcache.com/scan/
Common mistakes reading a cache hit rate
- Comparing this week’s number to a screenshot from before an update. Two readings from two meters are not a trend.
- Treating 0% as a dead cache. According to our 1.1.4 notes it was a counting gap on every non-nginx server.
- Reading a smaller denominator as damage. Dropping bots is the point of the change.
Frequently Asked Questions
My hit rate went from 94% to 61% the day I updated and I changed nothing. What happened?
Read the changelog for the version you installed. A same-day step with flat traffic is almost always a counting change, most often bot and 404 traffic leaving the denominator. Confirm with a header check before changing a setting.
I see 0% hit ratio but the site is clearly fast. Is the cache working?
Probably. Per our 1.1.4 release notes, hits were counted only on nginx until 9 August 2026, so Apache and LiteSpeed sites reported a permanent 0% while serving from cache normally. Update, then read it again.
My hit rate dropped slowly over two weeks rather than overnight. Does that change the diagnosis?
It does, and points away from the meter. A slope means genuine misses accumulating: new URLs unwarmed, an expiry set too short, or a preloader that cannot finish. Check cache lifetime against preloader interval.
I excluded bot traffic and my number got worse. Should I put it back?
No. Bots are cheap to serve from cache and were inflating the ratio without representing a visitor. A ratio measures how often the cache answered, not how much time it saved, and 48% of WordPress sites have under 100ms of cache headroom to begin with.
My plugin shows no hit ratio at all. What do I use instead?
The header check above works on any stack and needs no dashboard. Among plugins that do report one, W3 Total Cache lists caching statistics among its features, and our own xSpeed Cache charts a daily hit-ratio trend annotated with the setting changes that moved it. Coverage varies, so check what yours measures first.
Conclusion: read the meter before you chase the cache
A hit rate is a claim made by code about other code, and updating the plugin updates the claim. Before treating a drop as damage, spend a minute on the changelog and one request on the headers. Most drops reported after an update survive neither.
What to do this week:
- Run the header check on your slowest page and note what the second response said.
- Search the changelog for the version you installed for “ratio”, “count” and “bot”, then compare counted requests across the update boundary.
- If the shape is a slope rather than a step, check cache lifetime against preloader interval.
- If you would rather the measurement were handled than audited, xSpeed Cache charts the ratio with setting changes annotated on it. Free to start, Pro $29/yr at the founding price with a 14-day money-back guarantee. Free vs Pro shows where the line falls, pricing has the rest.
If the two checks disagree, bring the number to the community forum. That is worth a bug report.