Fix the Bytes First: Only 86 of 1,270 WordPress Sites Have a Clean Server, and 66 of Those Still Fail Mobile LCP
Updated October 2026
Chrome’s Lighthouse documentation, fetched 4 October 2026, says “aim to keep your total byte size below 1,600 KiB”. Our own scan rubric moved its full-marks page-weight line to 350KB on 1 October 2026, four and a half times lower. We harvested 3,039 scan reports to see which number a reader should act on, and the answer sets the order of every other fix. Of 1,270 WordPress sites graded on a mobile run, 86 pass every server check we grade, and 66 of those 86 still fail the 2.5-second Largest Contentful Paint threshold.
The question people ask is which speed fix is best. The more useful question is which fix moves the number you are judged on, and whether it is even available on your site. This ranking is built from eight published first-party studies plus one fresh measurement of how often each rung is open.
Quick Summary: What to Fix First
| If you want… | Do this first | Why |
|---|---|---|
| A better mobile LCP, the Core Web Vital | Cut transferred bytes until the mobile page is under 350KB, resizing before converting | Weight tracks mobile LCP at +0.706 and the rung is open on 92.0% of sites |
| A faster first byte | Get a cache hit, then make the CDN edge answer | 481ms and 298ms of measured median movement, the two largest single effects we have |
| A fix order for a client fleet | Sort by open rungs, not by audit severity | 82.8% of sites have four or more rungs open at once |
| To know when to stop | Stop at 350KB and move to render-blocking | Only 6 sites in 1,270 were clean on both and still failing |
The short version. Bytes first, on the device that decides. The server work is real and large, and measured on a different number than the one Google grades.
The Method, and Everything It Cannot Tell You
The limitations come before the results, because this ladder is observational and an ordering is exactly the kind of claim observational data cannot prove.
What we did. On 4 October 2026 we harvested every report in the public xSpeed Scan archive through https://xspeedcache.com/api/scan/{scanId}, the structured JSON twin of each report page: 3,039 reports, one per distinct hostname, zero fetch errors at 16 threads in 161 seconds. 2,045 are WordPress. The study population is the 1,270 WordPress hosts whose report carries a mobile run with both a Largest Contentful Paint and a transferred byte count, scanned 19 September to 4 October. Effect sizes are not re-derived here: each is cited to the post that measured it, with the instrument named.
Five limitations, the first two load-bearing.
- Association is not causation, and a ladder implies causation. Nothing here is a controlled experiment: we did not cut bytes on a site and re-measure. The ranking is a triage order built from how outcomes differ between sites, which is a prior for where to spend an afternoon rather than a guarantee of what you will get.
- Prevalence and effect come from different instruments. Prevalence is measured today from our own archive; the effects come from eight earlier studies, two of them live probes. One multiplied by the other gives a population estimate, not a per-site forecast.
- One URL per host, almost always a homepage, the lightest page on most WordPress sites.
- Lab mobile, not real users. web.dev’s own LCP reference states that LCP “includes any unload time from the previous page, connection set up time, redirect time, and other Time To First Byte (TTFB) delays which can be significant when measured in the field”. A one-location lab run understates exactly the fixes that operate on those delays.
- The sample is ours. These are sites someone chose to scan with our scanner, and 48.3% of the study runs xSpeed Cache. No sentence here says “of WordPress sites” without that caveat attached.
The Measured Priority Ladder
One row per candidate fix. Effect is the measured median movement from the study that measured it. Confidence is whether the effect survived a test in that study. Open on is how often the rung is available, measured today across the 1,270.
| Rung | Fix | Measured effect | Confidence | Open on |
|---|---|---|---|---|
| 1 | Cut page weight under 350KB | LCP failure 14.1% below 250KB against 93.6% at 1,024–1,536KB | Holds | 92.0% |
| 2 | Resize images before converting them | 73.2% of image bytes sit above the mobile display ceiling | Holds | 82.7% |
| 3 | Remove render-blocking resources | Below the weight cliff, 88% of still-failing sites fail this check | Directional | 90.2% |
| 4 | Make the LCP image discoverable early | Lighthouse audit, no first-party effect size yet | Unmeasured | 49.8% |
| 5 | Install or repair a page cache | First byte 674ms to 193ms, a 481ms cut, z = 19.8 | Holds on TTFB, null on LCP | 26.9% |
| 6 | Make the CDN edge answer the page | First byte 415ms to 117.5ms, a 298ms cut | Holds on TTFB, field-only on LCP | 20.9% |
| 7 | Fix the http:// redirect | Median hop 260ms, 32.9% of time to first byte | Holds, invisible to this archive | Not measurable here |
| 8 | Add a CDN at all | First byte moves 29ms in the lab; field LCP 3,132ms to 2,727ms | Weak in lab, holds in field | 63.9% |
| 9 | Move the origin | 199 sites hold a cache hit and still take over 400ms, median 642ms | Observational | 21.3% |
| 10 | Upgrade HTML compression | gzip saves a median 184.3KB; brotli adds 1.29KB on top | Real and tiny | 30.4% |
Effects come from the page-weight study (1, 3), the image census (2), the cache-hit lift study (5), the CDN study (6, 8), the redirect study (7) and the headroom study (9).
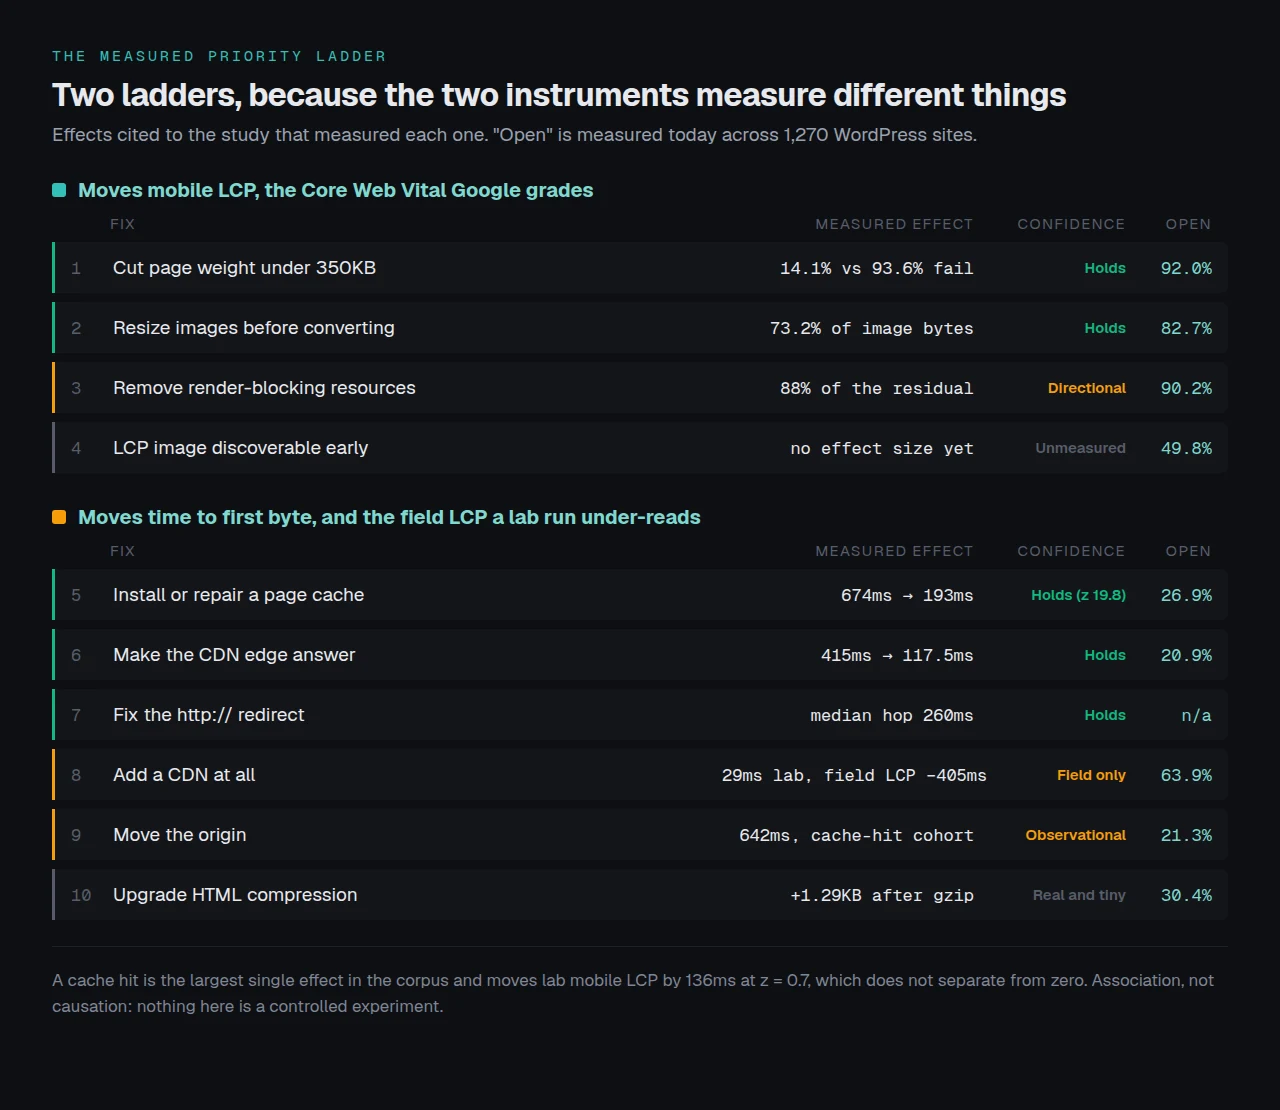
The median site has five of the nine measurable rungs open at once, so a complete pass is a project rather than an afternoon. Read the Confidence column before the Effect column. Rung 5 carries the largest number in the table and is the clearest case of a fix that does not move Core Web Vitals: a cache hit cuts the median first byte by 481ms at a rank-sum z of 19.8, while the same 2,030 sites show a mobile LCP difference of 136ms at z = 0.7, which does not separate at the 5% level. That is not an argument against caching. It is an argument against expecting a caching plugin to fix a Core Web Vitals assessment, the most common mis-ordering in WordPress performance work.
The Gate Question: Which Ladder Are You On
One subtraction tells you which half of the ladder applies: desktop score minus mobile score. The two-view study found five of the six delivery checks returning identical points in both views on every site measured, so the gap cannot contain server work. A wide gap exonerates your host.
| Desktop minus mobile | Sites | Median first byte | Median mobile LCP | Median mobile weight |
|---|---|---|---|---|
| 0 to 5 points | 245 | 358ms | 2,420ms | 1,011KB |
| 5 to 10 points | 237 | 417ms | 4,674ms | 1,861KB |
| 10 to 20 points | 577 | 272ms | 7,501ms | 2,084KB |
| Over 20 points | 208 | 206.5ms | 9,255ms | 2,163KB |
Read the first and last rows together. The narrowest gap carries the slowest server and the fastest mobile LCP; the widest gap carries the fastest first byte and a mobile LCP almost four times worse. As the gap widens the server gets faster and the page gets heavier, monotonically, across 1,267 sites. A small gap with both views failing points at the server, and it is the only shape in this data that does.
Rung 1: Page Weight, and Why 350KB Replaced 1.5MB
The curve reproduces at a larger and later cut of the archive than the one that first published it.
| Mobile transfer | Sites | Fail 2.5s LCP | Median mobile LCP |
|---|---|---|---|
| Under 250KB | 71 | 14.1% | 1,426ms |
| 250 to 500KB | 79 | 78.5% | 3,009ms |
| 500KB to 1MB | 204 | 83.3% | 4,245ms |
| 1 to 1.5MB | 171 | 93.6% | 6,153ms |
| 1.5 to 2.5MB | 247 | 95.5% | 8,551ms |
| 2.5 to 4MB | 199 | 98.0% | 11,544ms |
| Over 4MB | 299 | 97.7% | 15,747ms |
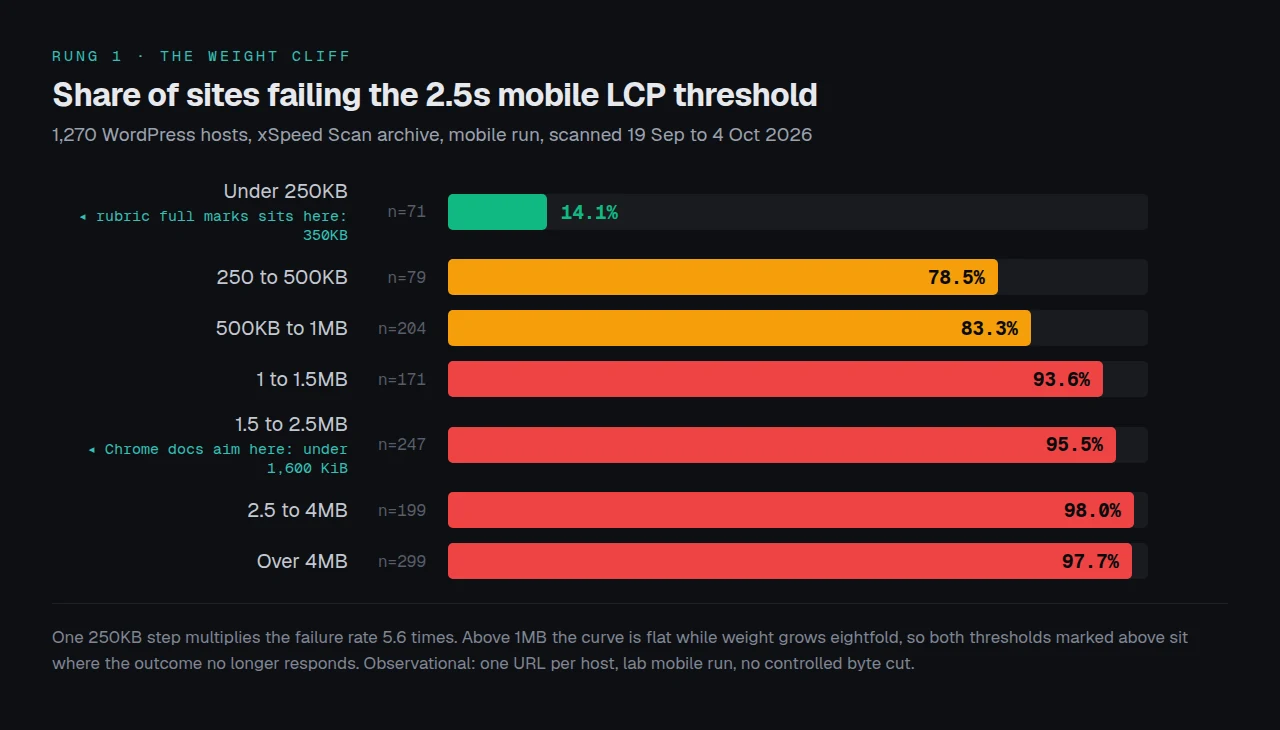
One 250KB step multiplies the failure rate 5.6 times. Above 1MB the curve is flat while weight grows eightfold. This is the same archive the earlier study used, three weeks later and 358 hosts larger, so treat it as a bigger cut rather than an independent replication.
Now put Chrome’s documented target on that curve. The Lighthouse network-payload audit says the median payload is “between 1,700 and 1,900 KiB”, flags pages over 5,000 KiB and recommends staying under 1,600 KiB. All three numbers sit in the flat part of the curve, where 93.6% to 98.0% of WordPress sites fail LCP. Hitting Chrome’s target exactly buys a roughly 95% chance of failing the Core Web Vital. The audit is not wrong that bytes correlate with load time. It is 3G arithmetic, and useless as a stopping rule.
Our median study site transfers 1,931KB on mobile. The rung is open on 92.0% of the study and on 97.3% of the 1,125 sites failing mobile LCP.
Where the bytes are, and the order inside the rung. The image census fetched 3,870 images from 368 WordPress homepages:
- 📐 73.2% of raster bytes sit in files wider than the 824px full-bleed mobile ceiling.
- 🗂️ 67.0% are still in a legacy format, and the overlap matters more than either figure on its own: 26.0% of all image bytes are already WebP or AVIF and still too wide.
- ✂️ Resizing recovers 67.9% of the recoverable bytes against 25.7% for converting, so resize first.
WordPress makes this harder than it should be. wp_calculate_image_sizes() declares the delivered file’s own width on 81.4% of the images that declare one at all, so the browser is told the file is already exactly the size it needs.
Rung 3: The Critical Path, Once the Bytes Are Gone
Below the cliff the bottleneck changes. The earlier weight study found 41 of 92 sub-500KB hosts still failing, with the same first byte and blocking time as the passing group, a first paint 1.5 seconds later, and the render-blocking check failing on 88% of them against 59%.
Six sites out of 1,270 are clean on every server check, under 350KB and still failing mobile LCP, and five of those six have the render-blocking check open. That is the floor of the ladder: after bytes and after the server, one rung is left and it is the critical path.
The Delivery Ladder Is Real, Large, and Measured on a Different Number
Nothing above says the server work does not matter. It says the server work is graded elsewhere.
The three largest single effects in the corpus are all on the server side:
- ⚡ 481ms from a cache hit, the largest effect we have measured on anything.
- 🌐 298ms from making a Cloudflare edge answer the page instead of forwarding it.
- ↩️ 260ms for the
http://tohttps://hop, which 88.8% of 919 reachable hosts pay and which no cache touches, because it happens before the cache runs.
Added together that is most of a second before a byte of HTML transfers. Then read what it buys: the ceiling study removed the entire measured server response from 361 LCP-failing WordPress sites and 337 of them, 93.4%, still failed. The server segment is a median 7.2% of LCP against 50.7% after first paint.
The field is the real exception. The CDN study’s lab numbers said CDNs do nothing, at a correlation of -0.040 against lab mobile LCP. Its 235 hosts with Chrome UX Report data said the opposite and said it monotonically: 3,132ms to 2,727ms to 2,127ms across the three CDN states, failure dropping 28.7 points. The mechanism is the one web.dev documents, that field LCP carries the connection setup and first-byte delays a one-location lab run mostly does not. So the delivery rungs are not cosmetic. They are badly observed by the instrument most people check. If your decision rests on field data, move rungs 6 and 8 up; if it rests on a Lighthouse score, they will not move it.
Compression is the one rung we would push down. gzip is worth a median 184.3KB per document, 81.7%, and already runs on 98.3% of WordPress sites. The brotli step on top is worth a median 1.29KB and is negative on 31.4% of byte-identical documents.
What Changed in Our Rubric on 1 October
Between 09:31 and 10:14 UTC on 1 October 2026 the scan rubric went from 2026.09.5 to 2026.10.1. Four check definitions changed, and three of them match findings this blog published in the preceding four days.
| Check | Before | After | Measured consequence |
|---|---|---|---|
| A5 page weight | ”Total page weight ≤ 1.5MB" | "Total page weight (≤ 350KB for full marks)“ | WordPress pass rate 38.0% (439 of 1,154) to 9.8% (11 of 112) |
| D3 compression | ”HTML compression (Brotli/GZIP)" | "HTML compression (bytes on the wire)“ | New compressionBytes field on 128 of 128 new reports and 0 of 2,911 older ones |
| D5 CDN | ”CDN / edge network" | "CDN edge serves the page” | Forwarding Cloudflare hosts: 241 of 241 scored full marks before, 0 of 21 now |
| W4 MCP | ”AI-controllable (xSpeed MCP)" | "xSpeed MCP endpoint reachable” | Naming only |
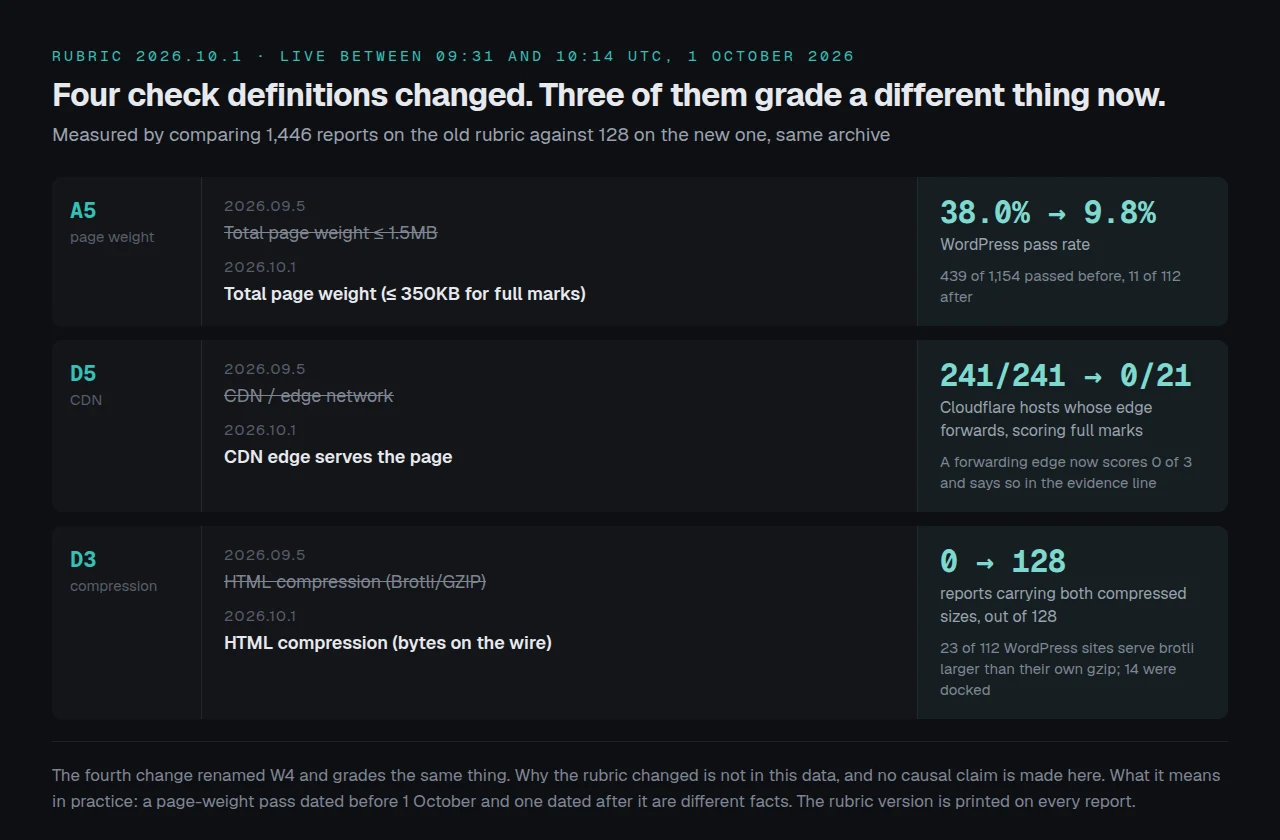
The behaviour changed, not only the labels. D5 now writes evidence like “Cloudflare is in front, but it passed this page through to your server (cf-cache-status: DYNAMIC)” and awards zero, which is what Cloudflare’s documented default cache behaviour predicts for HTML. D3 now carries both compressed sizes and docks a site to 2.5 of 5 when brotli runs materially larger than the same server’s gzip: 23 of 112 WordPress sites on the new rubric serve brotli larger than their own gzip, 14 were docked, and the smallest docked excess was 3,422 bytes while full marks held up to 1,559 bytes over.
What this study cannot establish is why. We can date the change, name the four definitions and show the direction matches three published measurements. Who decided and on what basis is not in this data, and a causal chain we did not observe is not one we will claim. The practical consequence is simpler: a page-weight pass before 1 October and one after it are different facts, and the rubric version is printed on every report.
How Our Own Sites Score on This Ladder
Both directions, under one caveat. 614 of the 1,270 study sites run xSpeed Cache and the sample is not random, so none of this is a product comparison.
| Measure | xSpeed sites (614) | Everyone else (656) | Who wins |
|---|---|---|---|
| Served from cache | 82.9% | 51.8% | Ours |
| Clean on all five server checks | 7.8% | 5.8% | Ours |
| Median mobile transfer | 2,143KB | 1,722KB | Theirs |
| Median mobile LCP | 7,094ms | 6,194ms | Theirs |
| Render-blocking rung open | 93.2% | 87.5% | Theirs |
| Median first byte | 295ms | 289ms | Theirs, narrowly |
We win the two things a caching plugin does and lose the two this ladder puts first. The selection effect runs through all of it: sites that install a caching plugin are often sites that already had a problem.
Nine of our own properties are in the study. All nine are over 350KB and not one is clean on all five server checks. trustsync.io transfers 1,915KB with a 19.4-second mobile LCP, sslcommerz.com answers in 2,653ms and essential-addons.com ships 8,191KB. We are publishing a fix order our own marketing sites do not follow yet.
Ordering This Work Across a Client Fleet
For one site the ladder is a reading exercise. For a fleet it is a sorting problem, and the useful output is the count of open rungs per site and which one is top rather than a score. Across the study, 82.8% of sites have four or more open and the median is five of nine.
Start with the free xSpeed Scan on each domain and read check A5 for weight, A1 for render-blocking and A3 for images. Every report also has a JSON twin at /api/scan/{scanId} and an MCP endpoint documented here, so a fleet audit is a loop rather than 25 browser tabs. No account, no key.
| Rung | Ours covers it | Note |
|---|---|---|
| 5 cache, 10 compression | ✅ | — |
| 2 image resize and convert | ✅ | Pro tier |
| 1 total weight | Partly | Scripts and fonts are yours |
| 3 render-blocking, 9 origin | ❌ | Theme and hosting work |
xSpeed Cache is ours, built by WPDeveloper, a Startise company. The 80-capability comparison shows where we sit against eight competitors, including the rows where we do not lead. A direct wordpress.org Plugin API query on 4 October 2026 returned 10,000+ active installs and a 5.0 rating from 17 ratings for version 1.3.7: a young plugin, and the honest reason we are absent from the third-party crawl censuses that rank the incumbents.
Run the free scan on your own site: xspeedcache.com/scan/
Two adjustments by stack:
- 🛒 On WooCommerce stores, product and category pages run heavier than the homepage measured here, and cart and checkout are never cached, so rung 9 arrives sooner.
- 🏢 On a fleet, xSpeed Hub reads the same checks across every site at once.
Common Mistakes Teams Make Ordering Speed Work
- Starting with the plugin because it is the cheapest change. It buys 481ms of a number Google does not grade.
- Treating an audit list as a priority list. Lighthouse orders by estimated saving on one page load, not by how often a fix is available or whether its effect survives a test.
- Converting images and stopping. 69.7% of hosts serving only modern formats still ship a file too wide for any phone.
- Accepting a stopping rule from documentation older than the data. 1,600 KiB puts you in the 95%-failure band.
Frequently Asked Questions
My site passed the page-weight check last week and fails it now. Did my site get heavier?
Probably not. Check the rubric version on both reports. Anything up to 2026.09.5 graded weight at 1.5MB; from 2026.10.1 full marks need 350KB. The WordPress pass rate went from 38.0% to 9.8% on the change alone.
I installed a caching plugin and my PageSpeed score did not move. What did I do wrong?
Nothing, most likely. Across 2,030 WordPress sites a cache hit cut the median first byte by 481ms and moved median mobile LCP by 136ms, which a rank-sum test puts at z = 0.7 and cannot call real. Check your transferred weight next.
I am under Chrome’s recommended 1,600 KiB. Why is my LCP still 6 seconds?
Because that target sits in the flat part of the failure curve. At 1 to 1.5MB, 93.6% of the sites we measured fail the 2.5-second threshold. The number worth aiming at is 350KB, where failure drops to 14.1%.
My desktop score is 40 points above mobile. Should I move hosts?
No. Five of the six delivery checks score identically in both views, so a wide gap cannot be your server, and here the widest-gap group has the fastest median first byte at 206.5ms. Look at weight and the critical path.
I converted everything to WebP and the page is still heavy. What did I miss?
Dimensions. 26.0% of image bytes are already in a modern format and still wider than the 824px mobile ceiling, and resizing recovers roughly 2.6 times what converting does.
Does a CDN help or not? Your own posts seem to disagree.
Each is true on its own instrument. Lab mobile LCP correlates with CDN presence at -0.040; field data on 235 hosts shows failure dropping from 70.4% to 41.7% across the three CDN states. Judged on real-user Core Web Vitals, a CDN helps. Watching a one-location lab score, it will not show up.
How do I tell whether my CDN is actually serving the page?
Read cf-cache-status on the HTML response, or check D5 on a report dated 1 October 2026 or later. Before that date the check scored CDN presence, so a Cloudflare site whose edge forwarded every page still took full marks, as 241 of 241 did.
Is brotli worth switching on?
Worth having, not worth a sprint. After gzip it saved a median 1.29KB across 159 byte-identical documents and ran larger than the same server’s gzip on 31.4% of them. Measure the bytes rather than trusting the header.
My first byte is 120ms and the page still takes 9 seconds. Is the scan broken?
No, it is the most common shape in the data. Removing the entire server response from 361 failing WordPress sites left 93.4% still failing. The server is a median 7.2% of LCP.
Which single number should I track weekly?
Mobile transferred bytes. It tracks field LCP at +0.322 while our own lab mobile LCP tracks it at +0.261, so a byte count predicts what Google’s real users see slightly better than the LCP on our own report.
Does this ladder apply to a site that is already fast?
If you are under 350KB with a clean server you are one of 6 sites in 1,270, and the remaining rung is render-blocking resources. If you pass LCP outright, stop: cutting bytes below the cliff bought nothing measurable here.
Conclusion: Your 2026 Fix Order
| Your situation | Start here | Stop when |
|---|---|---|
| Mobile LCP fails, page over 350KB | Resize images, then cut unused scripts | Mobile transfer is under 350KB |
| Mobile LCP fails, page under 350KB | Render-blocking CSS and JavaScript | First paint is under 1.8s |
| Judged on field Core Web Vitals | Add a CDN and make the edge answer | cf-cache-status reads HIT on HTML |
| First byte over 400ms with a cache hit | The origin, not the plugin | First byte is under 200ms |
What to do this week: run the free scan on your slowest page and note the rubric version. Read A5 for weight, A1 for render-blocking and A3 for images, in that order. Resize the three largest images to the width they actually display at. Re-scan and compare the mobile transfer figure, not the score. If rungs 5 or 10 are open, xSpeed Cache does page caching, compression and preloading from $29 a year at the founding price, with a 14-day money-back guarantee and a free tier that covers the caching rung on its own: see the plans.
If you re-run this on your own fleet, the numbers are more useful to us than the agreement. The archive is public, the JSON twin is one request per report, and the rubric version is on every one of them.