We Counted WordPress Caching Plugins Three Ways and Got Three Different Winners
 M Asif Rahman 18 min read

Updated October 2026
A direct wordpress.org Plugin API query on 16 October 2026 returns 7,000,000+ active installs for LiteSpeed Cache. The HTTP Archive Core Web Vitals Technology Report census, fetched the same morning, detects it on 285,305 origins. Our own scan archive, harvested at 03:07 UTC that day, found it on 313 WordPress sites.
The comparison people expect is a leaderboard: which caching plugin is most popular. The more useful comparison is between the instruments themselves, because we ran all three against the same question and got three different winners. This article publishes the method, the limits, and every number, including the one where our own archive makes us look like the market leader and is simply wrong.
Quick Summary / TL;DR
Too long, didn’t read? Three instruments answer “which caching plugin is this site running, and how many sites run it”. None of them answers the question you are probably asking.
| If you want to know… | Use this | What it actually counts | What it cannot see |
|---|---|---|---|
| How many copies are installed | wordpress.org Plugin API | Installs phoning home for updates, rounded into buckets | Anything not in the directory, and the exact figure |
| How widely a plugin is deployed on real traffic | HTTP Archive CWV Tech Report | CrUX origins whose home page carried a detectable footprint | Cached pages with no footprint, and 11 of its own listed technologies |
| What your site runs right now | Your own response headers | One URL, one request, one moment | Every other page and every other site |
| Whether that plugin is doing anything | A cache HIT or MISS on that header | Whether this response came from cache | Why it missed |
Three readings of LiteSpeed Cache on 16 October 2026: 7,000,000+ installs, 285,305 origins, 313 sites. The widest ratio between two instruments on one plugin in our table is 250,000 to 1.
The decision this hands you: stop quoting an adoption statistic, ours included, and read your own headers instead. Check whether your caching is working takes about a minute and answers for the site you actually own.
Three Instruments, Three Denominators, and Nothing to Average
Every sentence of the form “the most popular WordPress caching plugin” is answering whichever question its instrument asked. The three here measure different populations, share no denominator, and cannot be reconciled by arithmetic.
The three denominators, named
The wordpress.org Plugin Directory counts installations that check in for updates. Its denominator is unpublished, so no percentage can honestly be computed from it. The directory also displays its figures with a plus sign: LiteSpeed Cache’s listing reads “7+ million”, and our own plugin’s listing reads “10,000+”. Those are buckets, not measurements.
The HTTP Archive census counts origins. Per HTTP Archive’s own FAQ, it “crawls millions of URLs on both desktop and mobile monthly”, the URL list comes from the Chrome User Experience Report, and the list is fed to its private WebPageTest instance “on the 2nd Tuesday of each month”. Its denominator is 9,731,427 crawled origins, of which 3,414,639 are detected as WordPress.
Your own response header counts one URL. It is the narrowest instrument and the only one that answers for your site.
How This Was Counted, and the Six Things It Cannot Settle
Everything below was gathered on 16 October 2026 and can be reproduced in about ten minutes.
| Instrument | Query | Result |
|---|---|---|
| wordpress.org Plugin API | plugins/info/1.2/ per slug, browser UA | 19 slugs, 4 returned Plugin not found |
| HTTP Archive census | cdn.httparchive.org/reports/cwvtech/ dimension files | technologies.json 100,687 bytes, 2,048 technologies |
| Our scan archive | /api/scan-list?page=N across 141 pages, then /api/scan/<id> | 3,503 sites, 2,412 WordPress, 240 full reports sampled |
Six limits, all of which apply to every figure in this article:
- The census denominator is not WordPress. It is “WordPress origins with enough Chrome traffic to enter CrUX”. Chrome’s CrUX methodology requires an origin to be “sufficiently popular”, and states plainly that “an exact number is not disclosed”. So 3,414,639 is not the size of WordPress and must never be used as though it were.
- The census reads home pages only. HTTP Archive’s FAQ says it “examines each URL in the list, but does not crawl the website’s other pages”, and warns that “the landing page may not be representative of the overall site”. A plugin whose footprint appears only on inner pages is invisible to it.
- The census excludes anything not indexable. CrUX requires a page to be “publicly discoverable” using “the same indexability criteria as search engines”, so a
noindexheader or meta tag removes an origin entirely. - Detection is footprint-based, and footprints go missing innocently. WP-Optimize’s own FAQ states that “Cloudflare will strip out the special HTML comment at the bottom of the source of a page”, and adds that “it’s absence doesn’t indicate the cache is not working”. WP Fastest Cache ships the removal itself:
inc/cache.phpat line 1235 wraps its footer comment inapply_filters('wpfc_remove_footer_comment', false), with aWPFC_REMOVE_FOOTER_COMMENTconstant beside it. A low count is not a low deployment. - The directory figure is a bucket with no denominator. It cannot be turned into a percentage of anything.
- Our archive is a sample of people who chose to scan a site with us. It is the least representative of the three and the section below quantifies exactly how badly.
The census file was byte-identical in size on 3, 10 and 16 October, and every figure we re-read today matched the earlier two readings. It is a periodic crawl snapshot, not a live feed, so date any figure from it to the crawl rather than to your fetch.
The Disagreement Table: One Plugin, Three Numbers
This is the whole finding in one table. Each row is one plugin read by all three instruments on 16 October 2026.
| Plugin | Directory installs | Census origins | Our archive | Directory ÷ archive |
|---|---|---|---|---|
| LiteSpeed Cache | 7,000,000+ | 285,305 | 313 | 22,364× |
| WP Rocket | not in the directory | 354,098 | 122 | — |
| WP Super Cache | 1,000,000+ | 133,591 | 28 | 35,714× |
| WP Fastest Cache | 1,000,000+ | 76,946 | 40 | 25,000× |
| WP-Optimize | 1,000,000+ | 42,592 | 4 | 250,000× |
| W3 Total Cache | 900,000+ | 135,994 | 26 | 34,615× |
| Breeze | 300,000+ | absent | 13 | 23,077× |
| Cache Enabler | 100,000+ | absent | 2 | 50,000× |
| NitroPack | 90,000+ | 17,151 | 8 | 11,250× |
| Hummingbird | 70,000+ | absent | 1 | 70,000× |
| xSpeed Cache | 10,000+ | absent | 1,295 | 8× |
| WPCacheOn | 40 | listed, no count | 0 | — |
| FlyingPress | not in the directory | listed, no count | 0 | — |
Read pairwise on the LiteSpeed Cache row alone, the directory is 24.5 times the census, the census is 911 times our archive, and the directory is 22,364 times our archive. Three instruments, three different leaders. The directory crowns LiteSpeed Cache. The census crowns WP Rocket, which the directory cannot see at all because it is sold outside wordpress.org. Our archive crowns xSpeed Cache, which is ours, and that result is an artifact of who runs our scanner rather than a fact about WordPress.
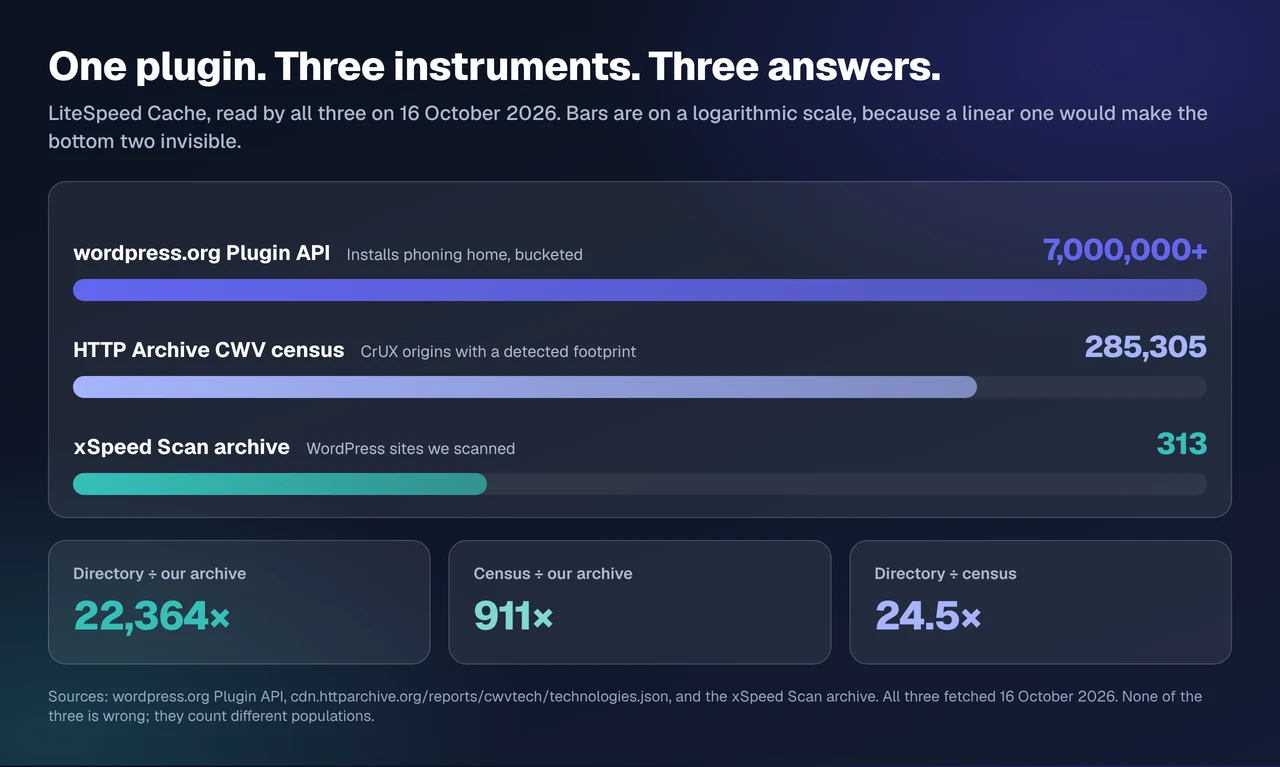
Two things are worth saying before anyone quotes a row from it. WP Rocket leads the census and has no directory row, so any article ranking caching plugins by install count has silently excluded the plugin that leads the deployment census. And the WP-Optimize row at 250,000 to 1 is the widest gap in the table, which says more about our archive’s size than about WP-Optimize.
The Denominator Test
Here is the framework this study contributes, and it is simple enough to apply to any adoption number you read.
Before you quote an adoption figure, do three things. Name the instrument. Name its denominator. Then divide the figure by that denominator and compare shares rather than counts. If two instruments still disagree after that, the disagreement is real. If they converge, the raw counts were never in conflict and the gap was pure denominator.
Applied to the two instruments that have a published denominator, the census at 3,414,639 WordPress origins and our archive at 2,412 WordPress hosts:
| Plugin | Share of census WordPress origins | Share of our WordPress hosts | Ratio |
|---|---|---|---|
| WP Rocket | 10.37% | 5.06% | 0.5× |
| LiteSpeed Cache | 8.36% | 12.98% | 1.6× |
| W3 Total Cache | 3.98% | 1.08% | 0.3× |
| WP Super Cache | 3.91% | 1.16% | 0.3× |
| WP Fastest Cache | 2.25% | 1.66% | 0.7× |
| WP-Optimize | 1.25% | 0.17% | 0.1× |
| NitroPack | 0.50% | 0.33% | 0.7× |
| xSpeed Cache | 0.00% | 53.69% | fails |
The test works. Counts that differed by factors of 11,250 to 250,000 come back as shares differing by factors of 0.1 to 1.6, which is ordinary sampling spread between a nine-million-origin crawl and a 2,412-site archive. The WP-Optimize row moves from 250,000× to 0.1×. Nothing was wrong with either count; the counts were answering different questions, and naming the denominator is what revealed it.
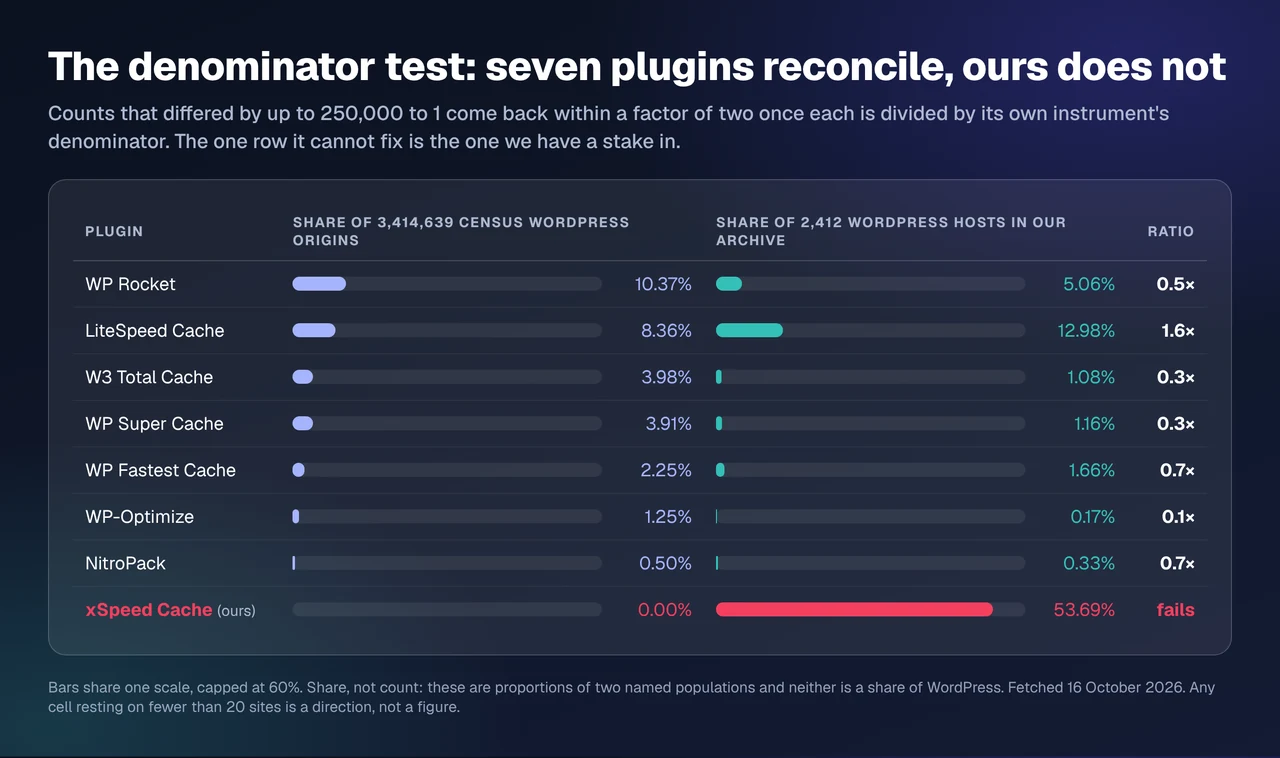
Two caveats. These are shares of two named populations, not of WordPress, and that distinction is the whole point of the test. And a share resting on 4 sites, as WP-Optimize’s 0.17% does, carries enormous uncertainty: treat any cell under about 20 sites as a direction rather than a figure.
Where the Test Fails, and the Row It Fails On Is Ours
xSpeed Cache is ours. It is a WPDeveloper plugin, and WPDeveloper is a Startise company, so every number about it in this article is a number about us.
The denominator test collapses on our row and it is the most informative result in the study. Our plugin is on 53.69% of the WordPress hosts in our own archive and on 0.00% of the census, because the census does not list us among its 2,048 technologies at all. There is no ratio to compute. A test that reconciled seven plugins to within a factor of two cannot touch the eighth.
Why our own archive over-samples us
The reason is structural. People scan a site with us because they are already using or evaluating our plugin, so our archive is a register of our own users with a sample of the wider web attached. Everyone else’s ratio sits in the thousands between the directory and our archive, and ours is 8. That inversion is the measurement: a plugin with 10,000+ installs showing up 1,295 times in a 2,412-site archive is not popular, it is over-sampled by roughly three orders of magnitude relative to its rivals.
This is also why no table in this article ranks plugins on our own archive. Our September census of 958 sites reached the same conclusion about the same dataset and published its per-plugin rows as “reported, not ranked”. That remains the right treatment.
Eleven Technologies in the Census Have No Number at All
The census proves its own limitation without any help from us. Its Caching and Performance categories list 57 technologies between them. Eleven of those 57 carry no origin count whatsoever: AiSpeed, Fasterize, FlyingPress, Jumbo, Naver RUA, Oracle Web Cache, Quicq, Render Better, SpeedSize, WPCacheOn, and one Shopify optimisation app. They are real products, named in the dataset’s own category map, with the count field simply absent.
FlyingPress is the clearest case for a WordPress audience. It is a commercial page-cache plugin with an active user base, it appears in both the Caching and Performance categories, and it has no number. Reading its absence as absence would be wrong.
WPCacheOn is the opposite case. It is listed in the Caching category with no count, and a wordpress.org API query returns 40 active installs and a last update of 28 September 2025. So a row in that category tells you a detector exists, not that the product is widely deployed.
Four Plugins Are Missing From the Census Entirely, Including Ours
Eleven missing counts is one kind of gap. A plugin absent from the census altogether is another, and four of them sit in our table, two with six-figure install counts.
| Plugin | Directory installs | In the census? | In our archive |
|---|---|---|---|
| Breeze | 300,000+ | ❌ | 13 |
| Cache Enabler | 100,000+ | ❌ | 2 |
| Hummingbird | 70,000+ | ❌ | 1 |
| xSpeed Cache | 10,000+ | ❌ | 1,295 |
There is a naming trap here too, and it is why a join between these two datasets cannot be automated. The census calls WP Super Cache “WordPress Super Cache”, which is not the plugin’s directory name, not its slug, and not the string a reasonable script would match on. Joining the directory to the census by name silently drops rows, and that is a measurement error nobody publishes.
The Sentence About 69% That We Are Not Going to Publish
Eight WordPress page-cache technologies in the census have counts: LiteSpeed Cache, WP Rocket, W3 Total Cache, WordPress Super Cache, WP Fastest Cache, WP-Optimize, NitroPack and wpCache. They sum to 1,047,302 origins of the 3,414,639 detected as WordPress, or 30.7%.
The arithmetic is correct. The complement is not a finding. “69% of WordPress sites run no page cache” would be false for at least four separate reasons already listed above: footprints that Cloudflare strips, footprints a filter removes on purpose, host-level caches that are not plugins at all, and eleven listed technologies with no count. Varnish alone appears on 205,362 origins in the same dataset and is not a plugin anyone installs from the directory.
The honest sentence is narrower and more useful: the census cannot see a cache that leaves no footprint, so its page-cache total is a floor and never a share. That is the finding, and it is the reason the only trustworthy answer about your site comes from your site.
The Only Instrument That Answers for Your Own Site
Every limitation in this article comes from the same source: the first two instruments are counting other people’s sites by proxy. The third one is not a proxy.
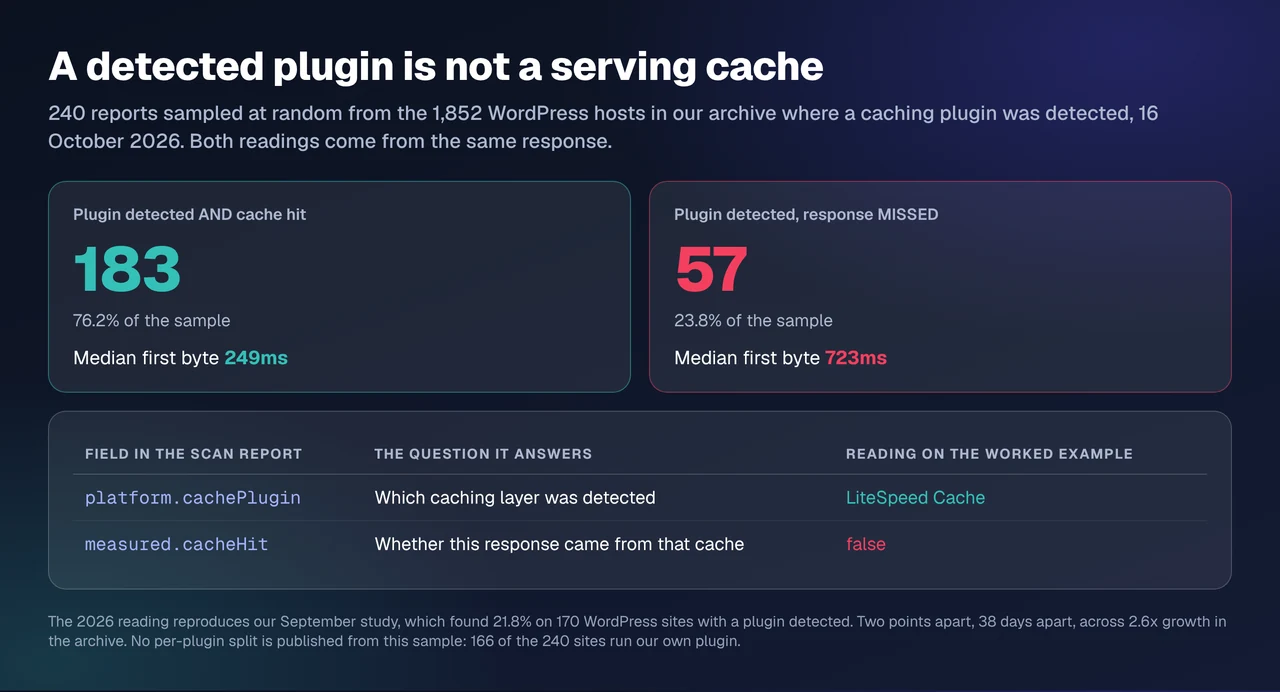
Our scanner reads the response your server actually sent, which is why its two cache fields are separate. platform.cachePlugin says a caching layer was detected. measured.cacheHit says whether that layer served this particular response. On one site in the sample the evidence line read: “Caching layer present (LiteSpeed Cache) but this response was not a cache hit”. Those are two different facts and most adoption writing conflates them. Check D2 in the scan rubric is the one that reports it, and the scan documentation lists what every check measures.
| Field in the report | The question it answers |
|---|---|
platform.cachePlugin | Which caching layer was detected in this response |
measured.cacheHit | Whether this particular response came from that cache |
We re-measured the gap on 240 reports drawn at random from the 1,852 WordPress hosts where a plugin was detected. 183 of 240 served a cache hit (76.2%), 57 did not, so 23.8% of sites with a caching plugin installed were not serving from cache when we looked. Median first byte was 249ms on the hits and 723ms on the misses. A slow first byte on a response that did hit cache is a separate problem with its own split, which our October study of 534 cache-hit sites measured. Our September study found 21.8% on the 170 WordPress sites that then had a plugin detected, so this reproduces within two points across 38 days and a 2.6× growth in the archive.
We are not breaking that 23.8% down by plugin. The largest cell that is not ours holds 41 sites, and 166 of the 240 are ours, so a per-plugin hit-rate table from this sample would be a ranking of our own user base. Our own plugin’s cell reads 137 hits of 166 sites, and publishing it is required by the same rule that stops us ranking anyone against it: the number goes in, with the caveat that makes it uninformative.
Run the free scan on your own site: xspeedcache.com/scan/
Common Mistakes People Make Quoting an Adoption Number
- Averaging two instruments. Seven million and 285,305 do not average to anything. They are different populations counted by different methods.
- Reading a bucket as a measurement. “7+ million” and “10,000+” are the directory’s own notation for a range.
- Computing a percentage from install counts. There is no published denominator to divide by.
- Treating absence as evidence. Four plugins here are absent from the census but present in the directory, two with six-figure counts.
- Ranking by the instrument that flatters you. Our archive ranks us first. We are not first, and the 80-capability comparison is where we would rather be judged.
- Quoting a count instead of checking your own site. The question most people are actually asking is whether their own cache works, which is a header away.
Frequently Asked Questions
Which caching plugin is actually the most popular?
The question has no single answer, which is the finding rather than a dodge. By wordpress.org installs it is LiteSpeed Cache at 7,000,000+. By detected CrUX origins it is WP Rocket at 354,098. Name the instrument in the same sentence as the number and the contradiction disappears.
Why does my plugin show a huge install count but barely appear in the HTTP Archive census?
Because the two count different things. Installs phone home for updates from every site including local, staging and low-traffic installs. The census only sees origins with enough Chrome traffic to clear the CrUX threshold, and only detects a footprint on the home page.
I could not find WP Rocket in the wordpress.org directory, is my search broken?
No. WP Rocket, FlyingPress and Perfmatters are sold outside wordpress.org and return Plugin not found from the Plugin API. A directory-only comparison excludes them by construction, and the census shows WP Rocket is the largest page-cache deployment in it.
Can I use the census to work out what share of WordPress sites run a cache?
No, and this is the most common misuse. Its denominator is WordPress origins in CrUX, not WordPress sites, and its page-cache sum of 30.7% is a floor because footprints go missing for several ordinary reasons.
My site runs a caching plugin but the scan says it was not a cache hit, is the scan wrong?
Probably not. Those are two separate measurements, and 23.8% of the sites we sampled were in exactly that state. Common causes are a cache that has not warmed, an exclusion rule covering the URL, a cookie bypassing the cache, or a query string. Our guide to checking whether caching is working walks the diagnosis.
Why is the xSpeed number in your own archive so much higher than your install count?
Because people scan a site with us when they are already using or evaluating our plugin. Our ratio of directory installs to archive appearances is 8, and every rival’s is in the thousands. The archive is a register of our users and should never be read as a market share.
How do I check what my own site is running without any of this?
Request your home page and read the response headers. Understanding cache HITs and MISSes covers the header names each layer sets, and the 60-second header check is the short version.
I averaged the two figures for a client report, how bad is that?
It produces a number that describes nothing. There is no population for which the mean of a directory bucket and a CrUX origin count is the answer. Report both with their instruments named, or report neither.
Is the HTTP Archive census updated often enough to cite?
It is a monthly crawl, fed to WebPageTest on the second Tuesday of each month per HTTP Archive’s FAQ. We read identical figures on 3, 10 and 16 October 2026, so date your citation to the crawl rather than to your fetch.
Does any free plugin give me a reliable adoption figure for my stack?
None of them, and that is not what they are for. If you want a count across sites you manage, scan them and read the detections. For choosing a plugin, the free caching plugin comparison is more decision-relevant than any install count.
How often is it worth re-running this?
Quarterly. The census moves monthly at most, directory buckets move slowly, and our archive grows a few hundred sites a month. We last ran the full three-instrument read on 16 October 2026.
Which number should I put in a pitch deck?
The one whose denominator you can state in the next sentence. If a slide cannot survive the question “out of how many”, the figure should not be on it.
Conclusion: Name the Instrument, Then Read Your Own Headers
Three instruments, one question, three different winners, and the one that crowns us is the one we built. The census and the directory are both useful and neither is wrong; they answer questions about populations you are not in. The denominator test reconciles them for seven plugins out of eight and fails loudly on ours, which is the clearest evidence in the study that first-party archives flatter their owners.
What each instrument is good for
| Your goal | Use | Why |
|---|---|---|
| Cite deployment on real traffic | HTTP Archive census | A published denominator of 3,414,639 WordPress origins |
| Cite install scale | wordpress.org Plugin API | Direct from the platform, as a bucket |
| Decide what to install | Capability comparison, not counts | Popularity is not fitness for your stack |
| Know what your site runs | Your own headers, or a scan | The only instrument that answers for you |
What to do this week:
- Pull the header on your own home page and record whether it was a HIT or a MISS.
- If a caching layer is detected and the response missed, read the exclusion and cookie rules before changing anything.
- Strike every unsourced adoption statistic from your own site’s content, including any you took from us.
- Re-check any comparison you rely on against its instrument, and treat counts under 20 sites as directions.
- Run the free scan for the full rubric, and if you want the caching layer itself, xSpeed Cache is free on wordpress.org, is one of several good options for WooCommerce stores, splits its modules as set out in Free vs Pro, and the paid tier starts at $29 a year with a 14-day money-back guarantee. It is ours, and the only honest number we have for it is 10,000+ installs.
Every figure here was fetched on 16 October 2026 and the queries are in the method table. Re-run them and tell us where your numbers differ from ours.