A Cache Hit Buys 481ms of First Byte and 2% of LCP in 2026

Updated October 2026
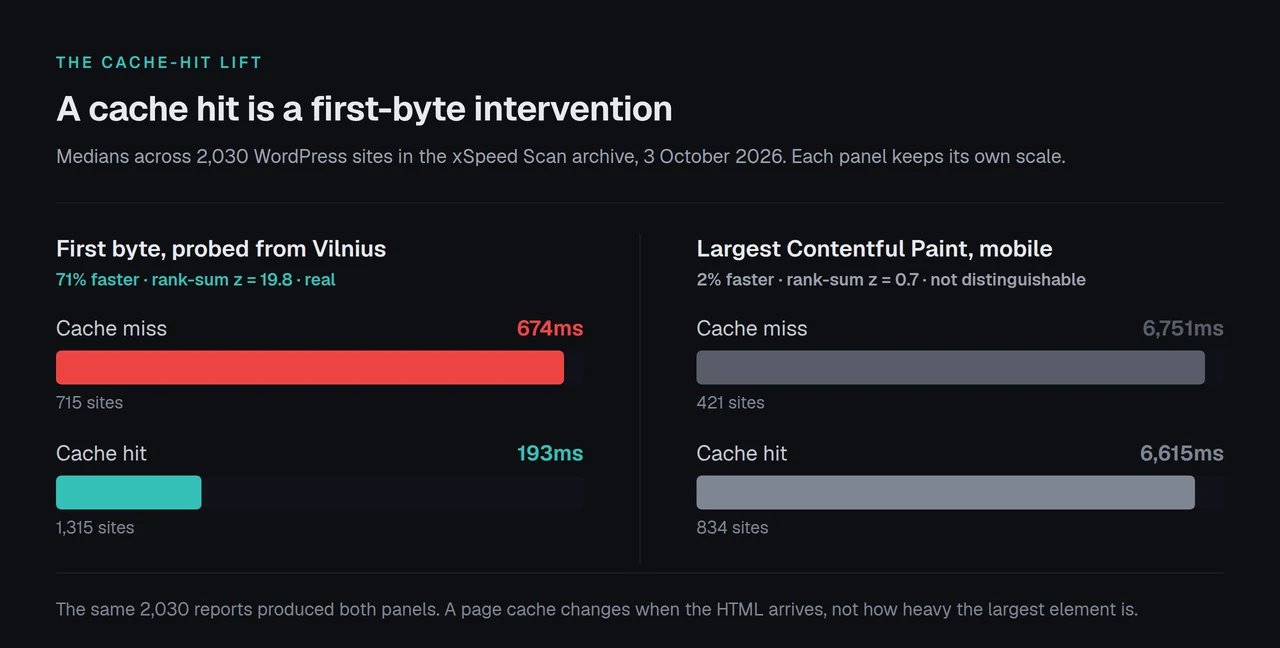
A cache hit cut the median first byte from 674ms to 193ms across 2,030 WordPress sites, fetched from the xSpeed Scan archive on 3 October 2026. The same hit moved median mobile Largest Contentful Paint by 136ms, a 2% difference a rank-sum test cannot separate from zero. The comparison people expect is cached sites against uncached ones. The more useful comparison is one cache hit measured by two instruments that disagree about its value by a factor of forty.
This is an observational study of sites someone chose to scan. The method and its three limitations are below, before any result.
Quick Summary: What One Cache Hit Is Actually Worth
| If you want | Do this | Why |
|---|---|---|
| A faster first byte | Install a page cache, then confirm a hit in your own headers | The median hit answers in 193ms against 674ms without one |
| A passing mobile LCP | Budget for images, fonts and render-blocking work instead | A hit moves median mobile LCP by 136ms, inside the spread |
| To know whether your cache is working | Read the response header, or run the free scan | Google’s server-response figure moves 11.5ms between a hit and a miss |
| To compare two caching plugins fairly | Check how each one signals a hit before you trust a hit rate | Header plugins read as a hit 83.4% of the time, comment plugins 20.7% |
| One number to watch weekly | Share of pages answering under 200ms | 51.6% of hits clear it against 18.2% of misses |
How This Was Measured, and the Three Places It Will Mislead You
Every report the xSpeed Scan has ever published is listed in a sitemap at /scan/r/sitemap.xml, and each one has a structured JSON twin at /api/scan/{scanId}. All 3,021 reports were fetched on 3 October 2026 at sixteen threads in 164 seconds with zero errors. Of those, 2,030 are WordPress, and every one of the 2,030 carries a cache verdict: 1,315 read as a hit (64.8%) and 715 as a miss (35.2%). The scans span 30 August to 3 October 2026 across 35 distinct days, one report per distinct hostname.
Two instruments sit inside each report and they are not the same instrument. The scan’s own probe measures the first byte from Vilnius, Lithuania, taking the best of two requests, and its evidence line states plainly that the figure “includes the network round trips between us and your origin, not just server time”. Google’s Lighthouse run reports a server-response-time audit for the same document. Both numbers are recorded, so both are used below.
Limitation 1: the population is not WordPress. It is sites someone chose to scan with our tool, and 1,058 of the 2,030 (52.1%) carry xSpeed Cache. People scan their own sites. Every figure here describes that population and nothing wider, which is why no sentence below says “of WordPress sites”.
Limitation 2: the delivery score contains the cache check, so part of the lift is circular. The delivery dimension is graded out of 30 rubric points and check D2, “Page served from cache”, is 7 of them. A hit therefore raises the delivery score by construction before it changes anything a visitor experiences. Both versions are published: as graded, and with D2 removed from the numerator and the denominator. Two fifths of the apparent delivery lift turns out to be the scoring of the hit itself.
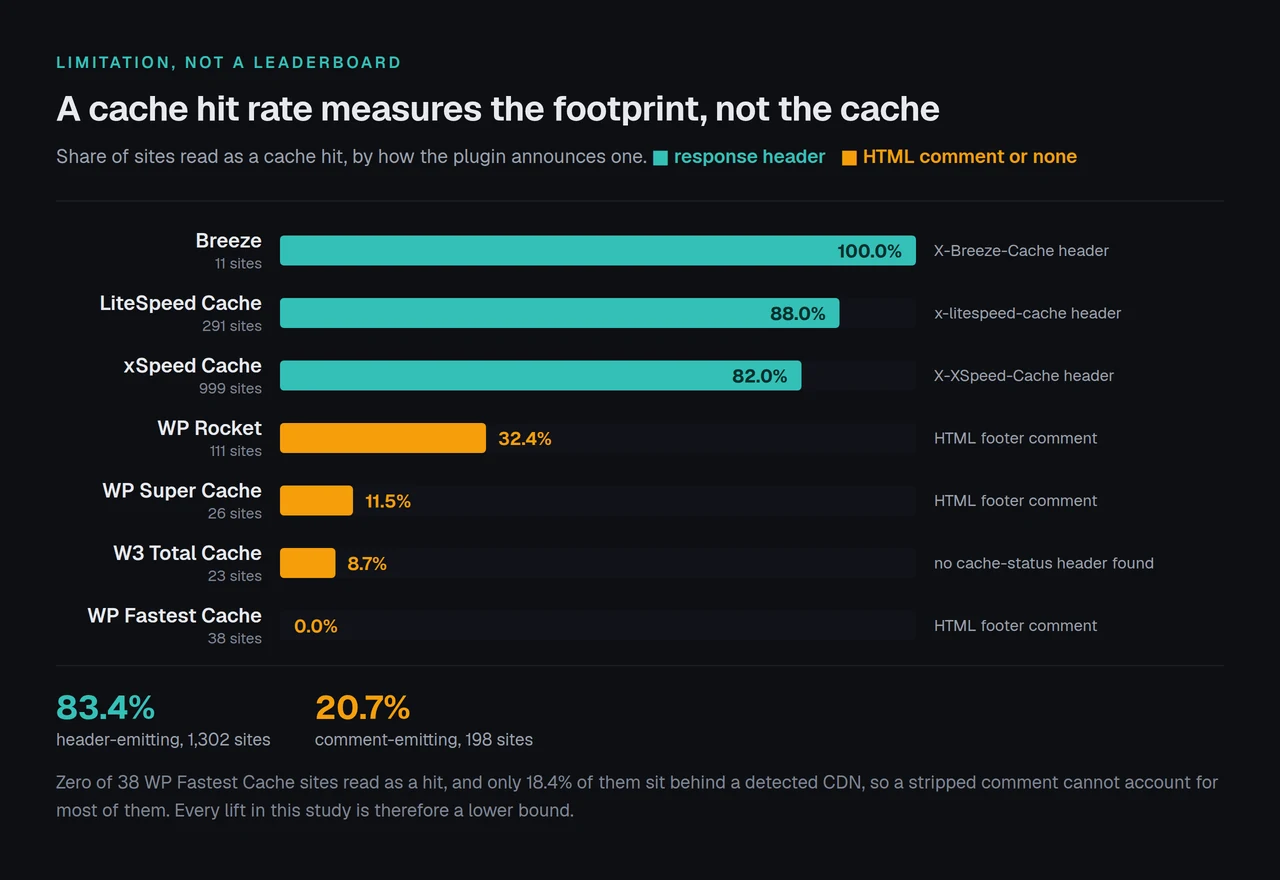
Limitation 3: a cache miss sometimes means an undetected cache, and it is plugin-shaped. Detection depends on the footprint a plugin leaves, and plugins leave two different kinds.
| Cache plugin | How it signals a hit | Sites | Read as a hit |
|---|---|---|---|
| Breeze | X-Breeze-Cache response header | 11 | 100.0% |
| LiteSpeed Cache | x-litespeed-cache response header | 291 | 88.0% |
| xSpeed Cache | X-XSpeed-Cache response header | 999 | 82.0% |
| WP Rocket | HTML comment in the page footer | 111 | 32.4% |
| WP Super Cache | HTML debug comment in the footer | 26 | 11.5% |
| W3 Total Cache | No default cache-status header found | 23 | 8.7% |
| WP Fastest Cache | HTML comment in the page footer | 38 | 0.0% |
Grouped by mechanism, the header-emitting plugins read as a hit on 83.4% of 1,302 sites and the comment-emitting ones on 20.7% of 198. Zero of 38 WP Fastest Cache sites produced a hit, which is not a result about WP Fastest Cache.
The obvious explanation does not survive a check. WP-Optimize’s own documentation states that “Cloudflare will strip out the special HTML comment at the bottom of the source of a page that is helpful to confirm that page caching is working, so, don’t be confused by that” (per the plugin’s FAQ on wordpress.org, verified on 3 October 2026). That mechanism is real, but only 18.4% of those 38 WP Fastest Cache sites sit behind a detected CDN, so a stripped comment cannot account for most of them.
What that does to the numbers below. The miss group holds an unknown number of sites that are cached and not seen, which pulls the two groups toward each other. Every lift reported here is therefore a lower bound on a correctly detected population, and the 64.8% hit rate is a property of our instrument as much as of the sites.
The Cache-Hit Lift Table
One row per outcome, medians throughout, with a verdict on whether the difference is distinguishable from zero. The rank-sum statistic is a normal-approximation Mann-Whitney z: beyond plus or minus 1.96 the two groups separate at the 5% level, and inside it they do not.
| Outcome | Cache hit | Cache miss | Change | Distinguishable from zero |
|---|---|---|---|---|
| First byte, our probe from Vilnius | 193ms | 674ms | 481ms faster | Yes, z = 19.8 |
| Server response, Google’s Lighthouse run | 37.0ms | 48.5ms | 11.5ms faster | Yes, z = 2.1, and small |
| Mobile LCP | 6,615ms | 6,751ms | 136ms faster | No, z = 0.7 |
| Desktop LCP | 1,241ms | 1,341ms | 100ms faster | Yes, z = 2.1, barely |
| Delivery dimension, as graded | 81 | 45 | 36 points | Yes, and partly circular |
| Delivery dimension, cache check removed | 65.2 | 43.5 | 21.7 points | Yes |
| Asset dimension | 40 | 38 | 2 points | No, z = 1.2 |
| Speed dimension | 80 | 76 | 4 points | Yes, z = 3.3, and small |
| Overall score | 71 | 56 | 15 points | Yes, z = 20.2 |
| Mobile page weight | 1.89MB | 2.10MB | 202KB lighter | Yes, z = 2.1, but selection |
| Share answering under 200ms | 51.6% | 18.2% | 33.5 points | Yes |
| Share passing a 2.5s mobile LCP | 12.0% | 10.0% | 2.0 points | No |
Read down the first-byte rows and the cache is doing exactly the job it is sold for. Read down the paint rows and it has almost no effect at all. Those two readings come from the same 2,030 reports, and holding them together is the whole point of the exercise.
The First Byte Is Almost the Whole Benefit
481ms is a large number in this field. Among the timings in that table it is the only change that is both large and distinguishable from zero. A cached page answers in 193ms, which clears the 200ms threshold the rubric grades against, and an uncached one answers in 674ms, which is more than three times slower. Half of cached pages clear 200ms against fewer than one in five uncached ones.
The 2,030 reports also put a floor under that figure. Our probe sits in Vilnius and its own evidence line says the measurement includes the round trips, so part of the 674ms on a slow site is distance rather than server work. The redirect study found the same thing from a different angle: a chain of redirects is paid before a cache can answer at all.
Where this stops being the cache’s win. Mobile pages on cached sites are 202KB lighter at the median, and no caching layer removes a kilobyte of image. Sites that have configured a cache tend to have configured other things too, which is selection rather than cause. The asset dimension itself moves 2 points, and at z = 1.2 that difference does not separate from zero at all.
LCP Does Not Move, and the Rank-Sum Test Says So Out Loud
The mobile LCP medians are 6,615ms with a hit and 6,751ms without one. The interquartile ranges are 3,716 to 11,877 against 3,827 to 12,250: almost perfectly overlapping distributions, on 834 and 421 sites respectively. The rank-sum z is 0.7, so this dataset cannot tell the two groups apart on LCP. For contrast, the same test on the first byte returns 19.8.
That matches what our earlier work found by other routes. The 958-site scan study recorded a 73% cut in first byte with LCP untouched, and the headroom study found both ends of the archive landing on the same median mobile LCP. This is the third independent cut of the archive to produce the same shape, now with a test attached rather than an eyeball.
Splitting by first-byte band makes the same point less politely. Inside each band the difference changes sign, which a real effect does not do.
| First-byte band | Sites, hit and miss | Mobile LCP on a hit | Mobile LCP on a miss | Difference |
|---|---|---|---|---|
| Under 100ms | 228 and 22 | 6,627ms | 9,734ms | 3,108ms for the hit |
| 100 to 200ms | 447 and 108 | 7,142ms | 8,233ms | 1,091ms for the hit |
| 200 to 400ms | 209 and 98 | 5,931ms | 5,364ms | 568ms against the hit |
| 400 to 800ms | 324 and 181 | 5,836ms | 6,602ms | 766ms for the hit |
| Over 800ms | 107 and 306 | 7,651ms | 6,608ms | 1,044ms against the hit |
Two of the five bands point against the hit, and one of them holds more misses than any other band: above 800ms, where misses outnumber hits almost three to one, the uncached pages paint faster.
Google’s own LCP documentation describes the metric as the render time of the largest element in the viewport, which on a WordPress page is usually an image or a heading behind a web font. A page cache changes when the HTML arrives. It does not change how heavy that image is, and the measurement says so.
Holding the Plugin Constant: the Lift Inside One Cache
Comparing cached sites against uncached ones compares two different sets of site owners. A narrower question is what a hit is worth among sites running the same plugin, where detection behaves the same way on both sides.
| Measured inside | Sites, hit and miss | First byte | Mobile LCP | Asset score |
|---|---|---|---|---|
| xSpeed Cache | 819 and 180 | 703ms faster | 257ms faster | 2.5 points |
| LiteSpeed Cache | 256 and 35 | 674ms faster | 829ms slower | 5.0 points |
The first-byte column reproduces almost exactly: 703ms and 674ms, against 481ms across the whole sample, which is the direction limitation 3 predicts once undetected caches are removed from the miss group. The LCP column does not reproduce at all. It points one way inside our own plugin and the other way inside LiteSpeed’s, on 35 misses, which is a sample too small to carry a claim and is reported here rather than dropped.
Our own plugin is where this gets least comfortable, and the number is published for the same reason every other number is. xSpeed Cache sites read as a hit 78.8% of the time against 49.5% for everyone else, and their median mobile LCP is 7,201ms against 6,155ms, with a median asset score of 35 against 45. We are better at the thing the cache does and worse at the thing it does not do. Part of the hit-rate gap is our own header being easier for our own scanner to see, and part of the LCP gap is that a plugin audience is not a random sample.
Checking a Cache Across Twenty-Five Sites at Once
At one site the whole question is answerable with a single request and a look at the headers, which the 60-second header check walks through and the hits and misses documentation explains per response. At twenty-five it stops being a per-site task, because the thing you need is not one verdict but the distribution of verdicts, and 376 of the 1,509 sites with a detected cache plugin in this sample returned no hit on the page that was scanned.
That 376 is the number worth carrying into agency work. A plugin being installed, active and configured is not evidence that the page a visitor requested came out of the cache, and the rubric records the difference: 263 of those sites earned a partial verdict whose evidence line reads “Caching layer present but this response was not a cache hit”. A quarter of the sites with a cache plugin were not serving a cached page at the moment they were measured.
Run the free scan on your own site: xspeedcache.com/scan/
Our own plugin, disclosed. xSpeed Cache is ours and WPDeveloper is a Startise company. What it does for this specific problem is emit X-XSpeed-Cache on every response, which is what made 999 of these sites machine-readable in the first place, and the cache diagnostics panel reports the same verdict in the dashboard. The 80-capability comparison sets out what the other eight plugins do and do not expose, and Free vs Pro separates what the free tier covers. For WooCommerce stores the cart and checkout routes are excluded from the page cache by design, so a miss on those paths is correct behaviour rather than a fault.
The Instrument Problem: PageSpeed’s Server-Response Line Cannot See Your Cache
This is the finding that changes what a reader should do tomorrow. Every report carries both measurements of server response, so they can be compared on 1,258 sites that have both.
| Our probe reads | Sites | Our median | Google’s median | Gap |
|---|---|---|---|---|
| Under 100ms | 141 | 56ms | 23ms | 29ms |
| 100 to 200ms | 369 | 133ms | 20ms | 107ms |
| 200 to 400ms | 201 | 277ms | 48ms | 213ms |
| 400 to 800ms | 288 | 556ms | 143ms | 417ms |
| 800ms to 2s | 200 | 1,080ms | 120ms | 928ms |
| Over 2s | 59 | 2,960ms | 65ms | 2,800ms |
Our probe ranges across a factor of 53, from 56ms to 2,960ms. Google’s figure for the same documents stays inside a band from 20ms to 143ms the whole way down, and the slowest cohort of all reports 65ms. The gap between the instruments is not a constant: it grows with our own measurement, from about half of it in the fastest band to 95% of it in the slowest.
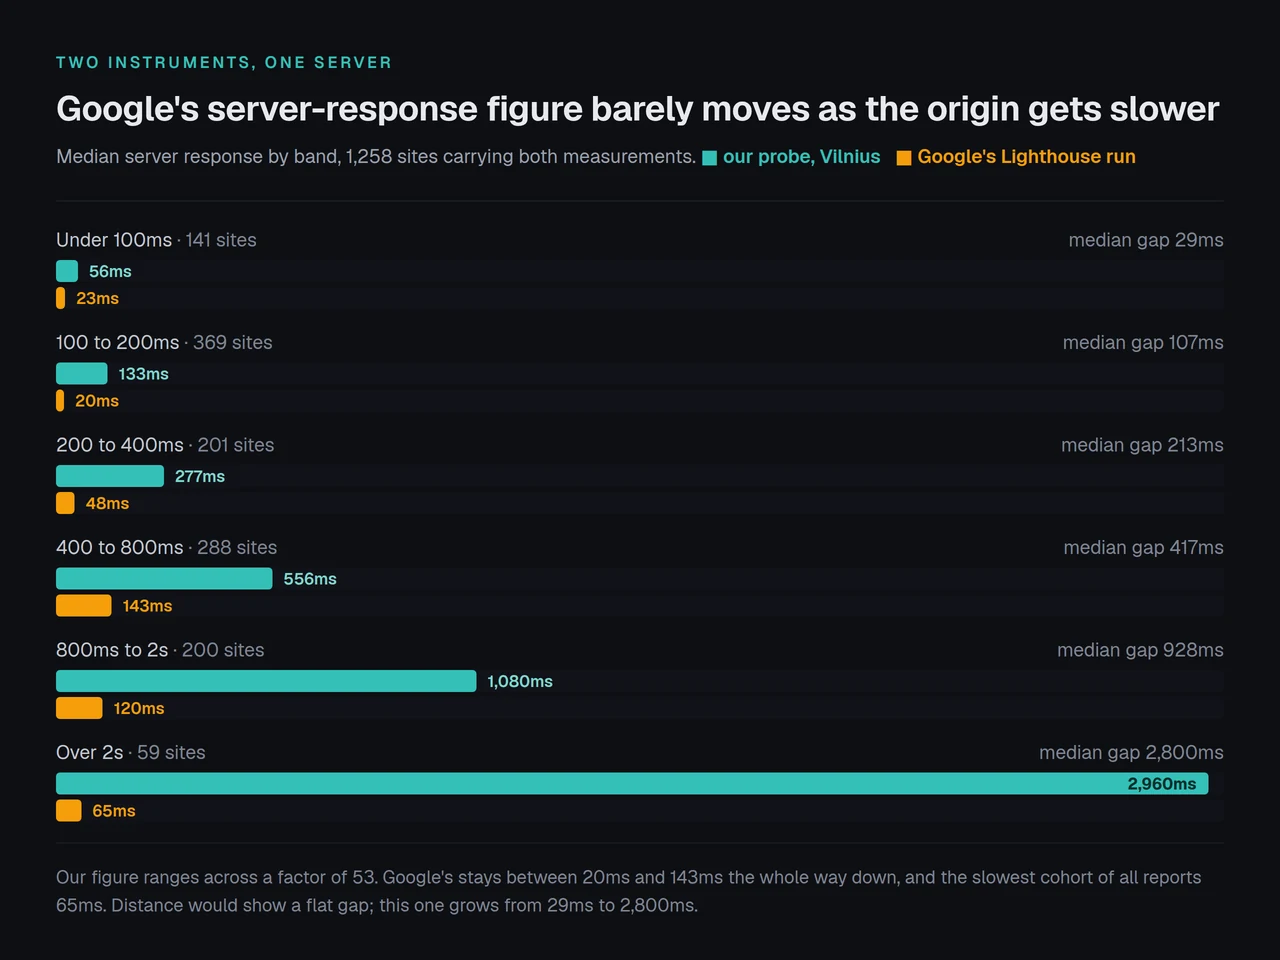
Two explanations can be ruled out from the data. Network distance is additive, so a fixed offset for the hop to Vilnius would show a flat gap across every band, and the gap instead grows from 29ms to 2,800ms. Warm-up ordering is the other candidate, and the timestamps settle it: in all 1,260 reports carrying both, Lighthouse ran before the scan’s own probe finished, a median of 21 seconds earlier. The slower instrument is the later one, so our probe cannot be the one catching a cold cache.
What cannot be established from a report. Why Google’s number compresses is not visible here, and this run will not guess at it. What is measurable is the consequence, and it is the same whatever the cause: across hits and misses the two instruments value the same cache hit at 481ms and at 11.5ms.
So the practical rule has nothing to do with which number is correct. If you are checking whether a cache is working, the server-response-time line in a PageSpeed report is the wrong gauge, because it barely separates a hit from a miss. Google’s documentation for that audit describes it as the time for the main document to start arriving in its own run, and its first-byte guidance treats field data as the reference for what visitors experience. Read your own response header instead, as the caching receipt guide sets out, or let a probe outside your network do it. Both answer in seconds, and the page cache documentation lists which routes are expected to miss.
Common Mistakes Site Owners Make Reading a Cache Verdict
- 🔁 Treating one measurement as a state. 263 sites in this sample had a caching layer present and no hit on the request that was measured. A single probe reports one response, not a configuration.
- 📉 Expecting LCP to follow the first byte. The two moved 136ms and 481ms in the same dataset. Caching and paint are separate budgets with separate work behind them.
- 🧪 Comparing hit rates across plugins without checking the footprint. A 0% hit rate across 38 sites is a detection result. Ask how the plugin signals a hit before reading its rate as performance.
- 📊 Grading a cache with a score that contains the cache. Two fifths of the delivery lift here was the cache check scoring itself. Remove the check, or quote the metric instead of the score.
- 🌍 Reading an externally probed first byte as server time. Our own figure includes the network hops and says so in the report. Subtract nothing and claim nothing about the server alone.
Frequently Asked Questions
My cache says HIT but PageSpeed still reports a slow server response. Which one is wrong?
Neither, and this dataset shows the pattern is normal rather than a fault. The two figures measure differently defined quantities, and across 1,258 sites the gap between them scaled with the externally probed value rather than staying constant. If the response header says HIT, the page came out of a cache.
I installed a caching plugin and my LCP did not improve. Did I do something wrong?
Probably not. Median mobile LCP in this sample differed by 136ms between cached and uncached pages, and a rank-sum test could not distinguish the two groups at all. LCP work is usually image weight, font loading and render-blocking resources.
How much should a cache hit actually save me?
On this population, 481ms at the median on an externally probed first byte, moving 674ms to 193ms. Your own saving depends on what your origin takes without a cache, which is the headroom calculation rather than an average.
My plugin is active but the scan says the page was not cached. Why?
That describes 376 of the 1,509 sites here with a detected cache plugin. Common reasons are a logged-in session, a query string on the URL, an exclusion rule covering the path, or a cache that had not been warmed for that page yet.
Why did my WP Fastest Cache site show no cache evidence?
Zero of 38 WP Fastest Cache sites in this sample read as a hit, so this is a limitation of the measurement rather than a verdict on the site. That plugin signals a hit with an HTML comment, which is less reliable to detect than a response header.
Is a 64.8% cache hit rate good?
It is not a benchmark worth chasing, because the figure is specific to the sites that were scanned and to how each plugin advertises a hit. Header-emitting plugins read at 83.4% here and comment-emitting ones at 20.7%, on the same scanner.
Does a CDN change the answer?
Holding CDN presence fixed, the first-byte lift survived in both groups: 522ms among sites with a detected CDN and 447ms among those without. LCP did not, and it pointed opposite ways: 301ms against the hit where a CDN was detected and 167ms in favour where none was.
What should I measure weekly if I only track one thing?
The share of your pages answering under 200ms. In this sample 51.6% of cache hits cleared it against 18.2% of misses, which makes it the number that actually responds when caching changes.
Which caching plugin comes out ahead in this data?
This study does not rank them, and it cannot: hit rate here reflects detectability as much as behaviour. xSpeed Cache is one option among several and it is ours; LiteSpeed Cache read highest among the large groups at 88.0%, and on LiteSpeed-powered hosting its server-level cache is a genuine advantage.
Can I reproduce this myself?
Yes, and that is the point of publishing the method. The report sitemap and the JSON twin for each report are both public, the whole harvest took 164 seconds, and every figure above comes from fields any reader can fetch and recount.
Conclusion: Cache for the First Byte, Budget Separately for the Paint
A cache hit is a first-byte intervention. On 2,030 WordPress sites it was worth 481ms there and 136ms on mobile LCP, and only one of those two survives a significance test. Anyone promising that a caching plugin will fix Core Web Vitals is selling the 481ms and quietly implying the rest.
| Your goal | What to pick | What it will not do |
|---|---|---|
| Cut server response time | A page cache with a readable hit header | Reduce image or font weight |
| Pass mobile LCP | Image sizing, modern formats, font and render-blocking work | Lower your first byte much |
| Verify a cache across many sites | A probe outside your network, reading headers | Replace per-route exclusion review |
| Decide whether caching is worth it at all | The headroom calculation on your own origin | Tell you anything about paint |
What to do this week: read the response header on your slowest page and record whether it says HIT. Measure the first byte from outside your own network, twice, and keep both numbers. Check the routes you expect to miss, so a correct miss is not logged as a fault. Stop using the PageSpeed server-response line as your cache receipt. Then, if the headroom is there, xSpeed Cache is $29 a year at the founding price with a 14-day money-back guarantee, it is rated 5.0 from 17 ratings on wordpress.org as of 3 October 2026, and it emits the header that made this entire study measurable.
The archive took on 71 new reports a day over the last seven complete days, so this cut will read differently in December. If you re-run it and the LCP column moves, that is worth knowing, and the method above is written so you can.