The Best Website Performance Monitoring Tools in 2026
Your site was fast when you launched it. Is it still fast today? Most site owners only find out when something goes wrong: a client complains, sales dip, or Google Search Console sends a warning.
Performance monitoring is how you find out first. The right tools tell you how fast your pages load, how real visitors experience them, and when something changes for the worse, so you can fix it before anyone notices.
This guide compares the best website performance monitoring tools in 2026, explains what each one is good at, and shows you two ways to stay on top of it: a simple manual routine, and an easier one where xSpeed Scan and your AI assistant do most of the work.
Key Takeaways
- Speed changes over time. Plugin updates, new content and third-party scripts slowly make a fast site slower. Checking once isn’t enough.
- Use two kinds of data. Lab tests help you find problems. Real visitor data (field data) tells you whether those problems actually affect people.
- Watch more than the score. Core Web Vitals, server response time, page weight and your cache hit ratio explain why a score moves.
- No single tool does everything. Most people need one free speed test, one source of real visitor data and one way to get alerts.
- Finding problems is only half the job. Most monitoring tools stop at the diagnosis. Pair them with a performance plugin, or use xSpeed Scan’s AI prompt so your assistant can help fix what it finds.
What Is Website Performance Monitoring?
Website performance monitoring means checking your site’s speed and stability on a regular schedule, not just once. A one-off speed test tells you how a page performed at one moment. Monitoring tells you whether things are getting better or worse, and warns you when they slip.
Good monitoring answers three questions:
- Is my site fast right now? A quick test gives you a baseline.
- Is it fast for real visitors? Real devices and real networks are slower than test machines.
- Did something just change? Alerts and history show you when performance dropped, so you can connect it to a cause.
Why Websites Slow Down Over Time
A website rarely becomes slow overnight. It usually happens in small steps:
- New plugins, apps and updates add scripts and styles to every page, even pages that don’t use them.
- Content grows. More posts, products and large images make pages heavier.
- Third-party scripts pile up. Analytics, chat widgets, ad tags and tracking pixels each add a little delay.
- The cache quietly stops working. A new plugin that sets a cookie for every visitor, or an exclusion added by mistake, can stop pages from being cached.
- Hosting falls behind. More traffic on the same plan means slower server responses at busy times.
- Design changes like sliders, animations and extra fonts slowly make the first screen heavier.
Each change seems small on its own. Monitoring catches the moment they start to add up.
Lab Data, Field Data and Server Health
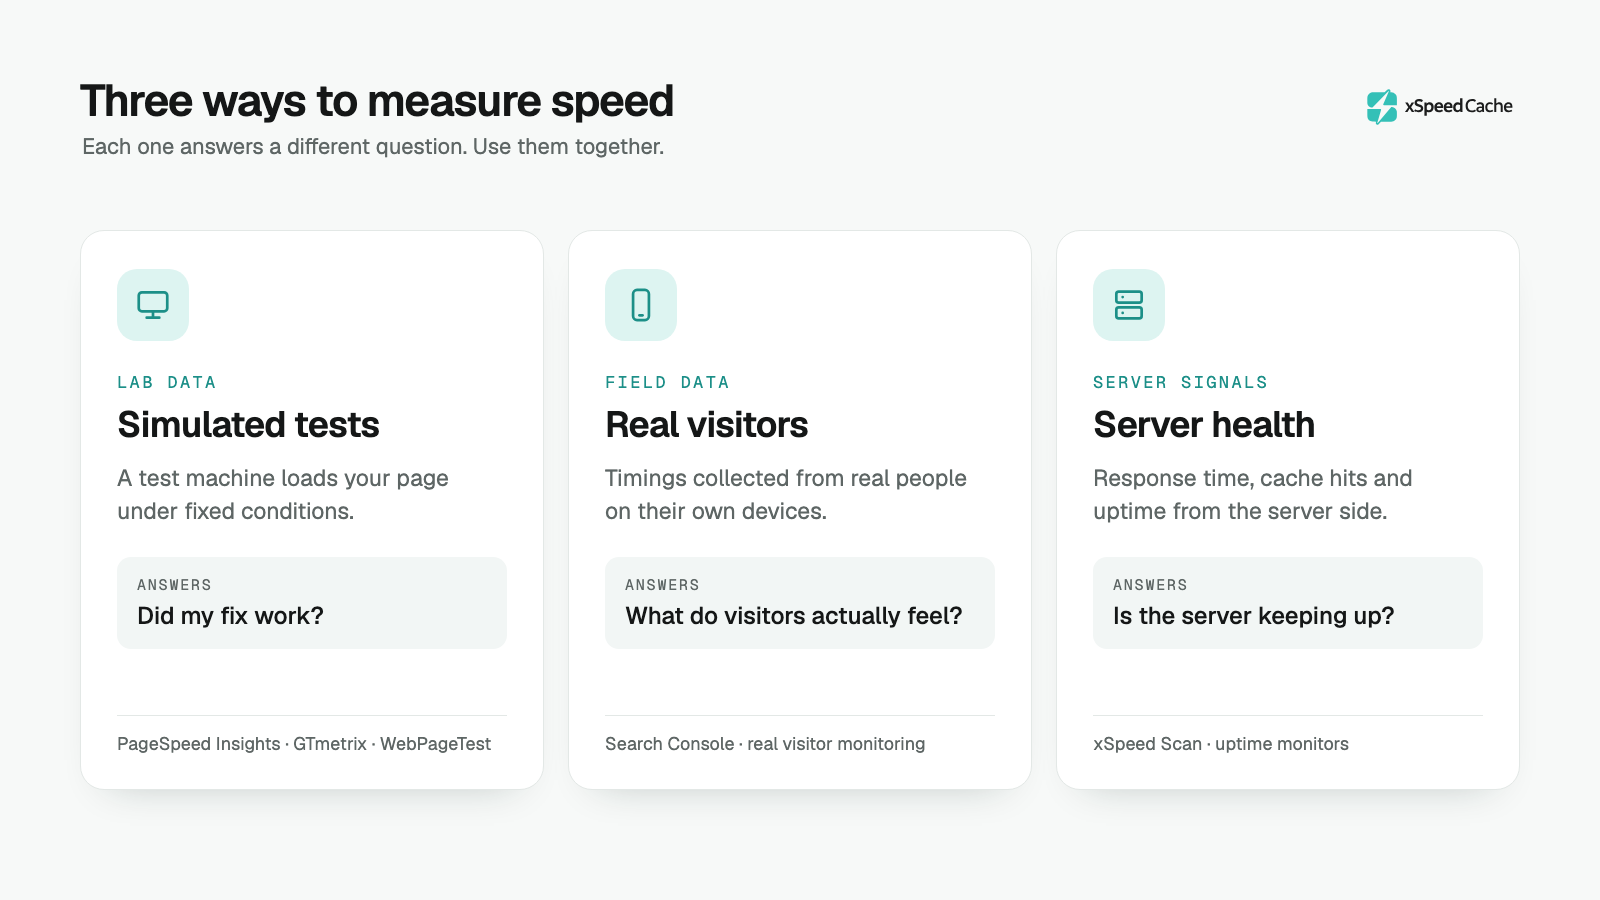
Performance tools measure your site in three different ways. Each one answers a different question, so it helps to know which kind of data you’re looking at.
| Type | What it is | Best for | Watch out for |
|---|---|---|---|
| Lab data (simulated tests) | A test machine loads your page under fixed conditions | Finding problems and checking whether a fix worked | One machine on one connection, not your real visitors |
| Field data (real user monitoring) | Timings collected from real visitors’ browsers | Seeing what people actually experience | Needs traffic, and takes days or weeks to update |
| Server health | Your server’s own view: response time, cache hits, uptime | Spotting caching and hosting problems early | Doesn’t show what happens inside the browser |
Lab and field data often disagree, and that’s normal. A page can score well in a lab test and still feel slow for visitors on older phones. When they disagree, field data describes what real people get. We dug into this in our study of sites that pass Lighthouse but fail Core Web Vitals.
The Metrics Worth Monitoring
A performance score is a summary. These are the numbers underneath it that tell you what to fix:
| Metric | What it measures | Good target |
|---|---|---|
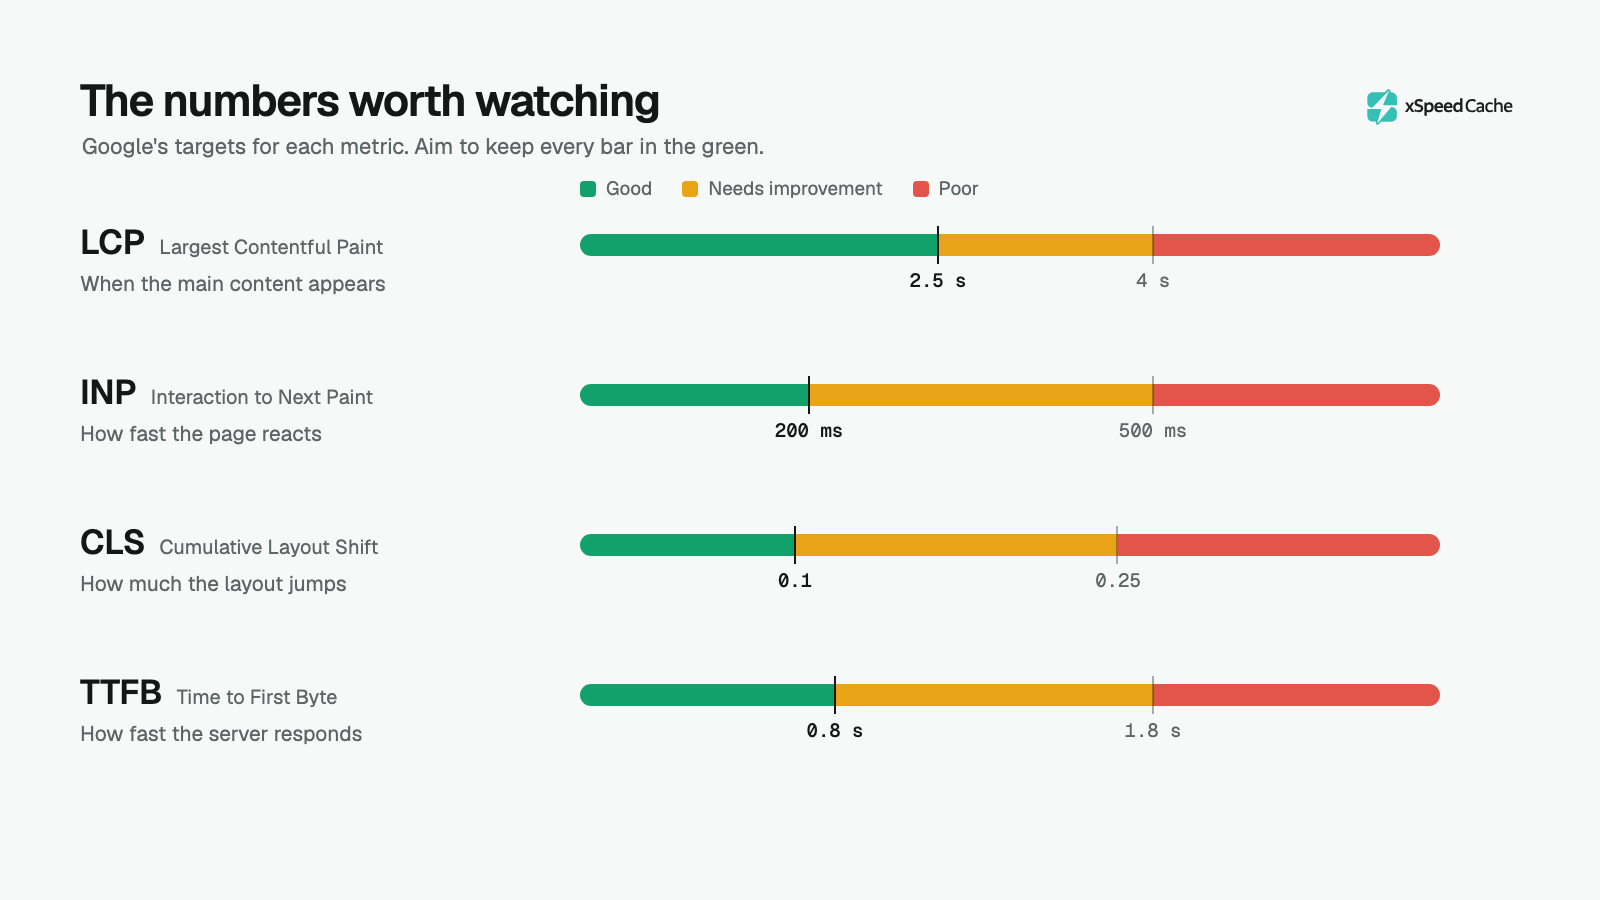
| LCP (Largest Contentful Paint) | When the main content appears | 2.5 seconds or less |
| INP (Interaction to Next Paint) | How quickly the page reacts to clicks and taps | 200 milliseconds or less |
| CLS (Cumulative Layout Shift) | How much the layout jumps while loading | 0.1 or less |
| TTFB (Time to First Byte) | How quickly your server starts responding | About 0.8 seconds or less |
| Page weight | Total size of everything the page downloads | As light as practical |
| Cache hit ratio | Share of visits served from cache | 80% or higher on a site with steady traffic |
| Uptime | Whether your site is reachable | As close to 100% as possible |
LCP, INP and CLS are Google’s three Core Web Vitals. Lab tests can’t measure INP, because no real person is clicking, so they use Total Blocking Time (TBT) as a stand-in. If you’re not sure how to read these numbers in a report, our guide to reading a PageSpeed report walks through each one.
8 Website Performance Monitoring Tools Worth Knowing
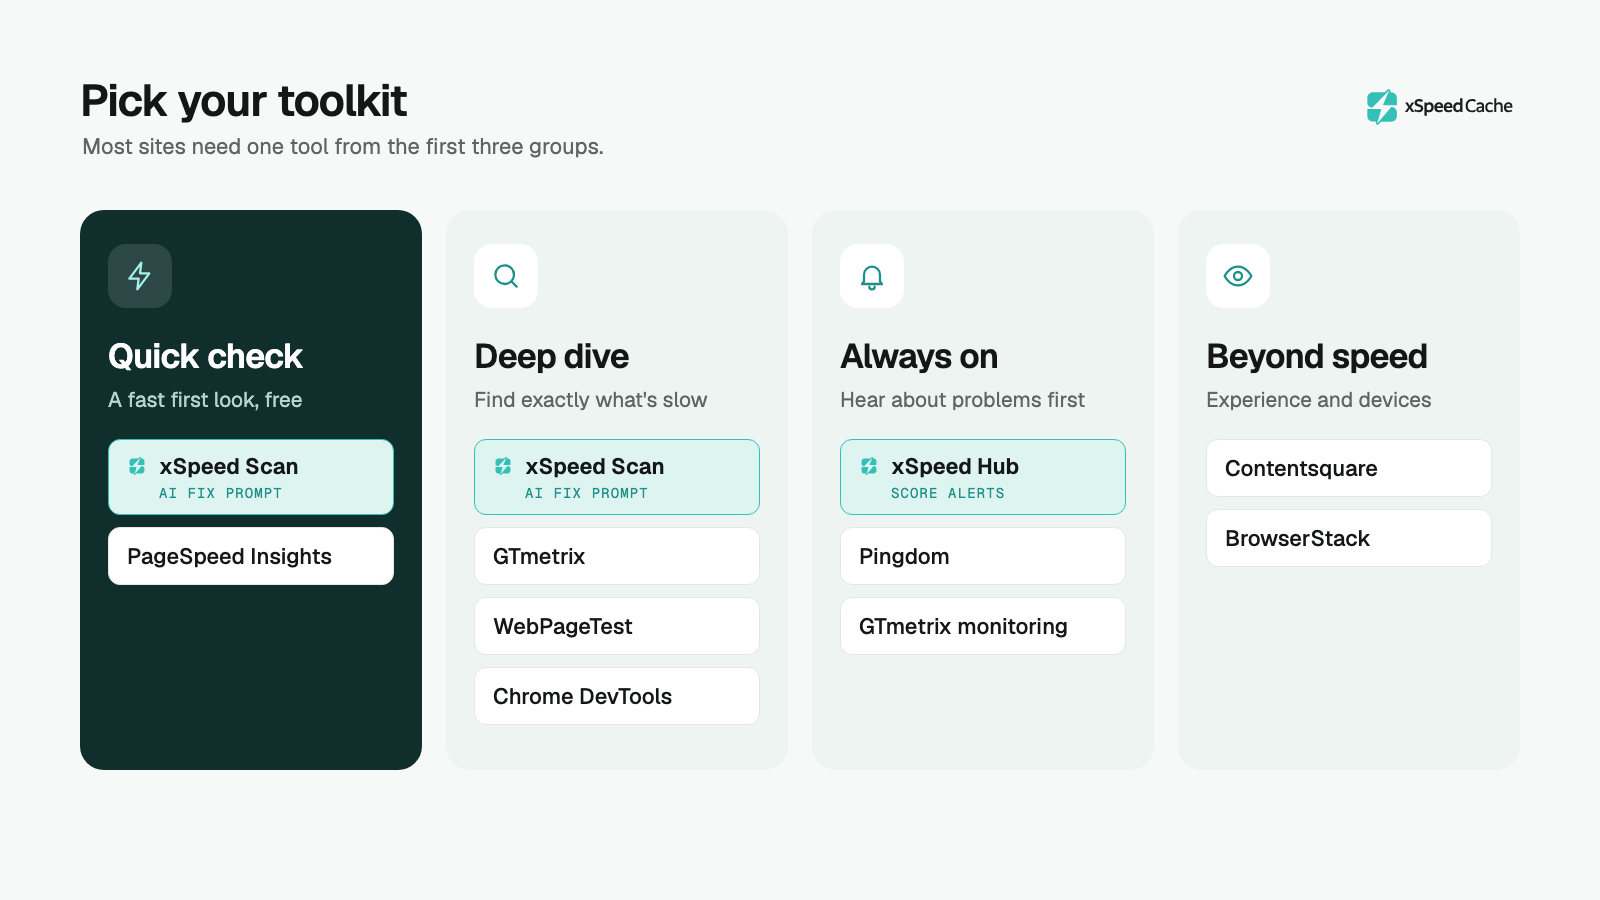
Here are eight tools worth knowing. The first six cover speed and uptime, from quick free checks to always-on monitoring. The last two cover user experience and device testing. Most sites only need two or three of them.
1. xSpeed Scan
Type: Simulated tests, real visitor data (from Google’s Chrome UX Report) and server checks
xSpeed Scan is our free scanner, and it works on any website, not only WordPress. It runs Google Lighthouse on mobile and desktop, adds its own server checks for response time, caching, compression and redirects, and grades the whole site from 0 to 100. The report is ready in 20 to 60 seconds with no signup.
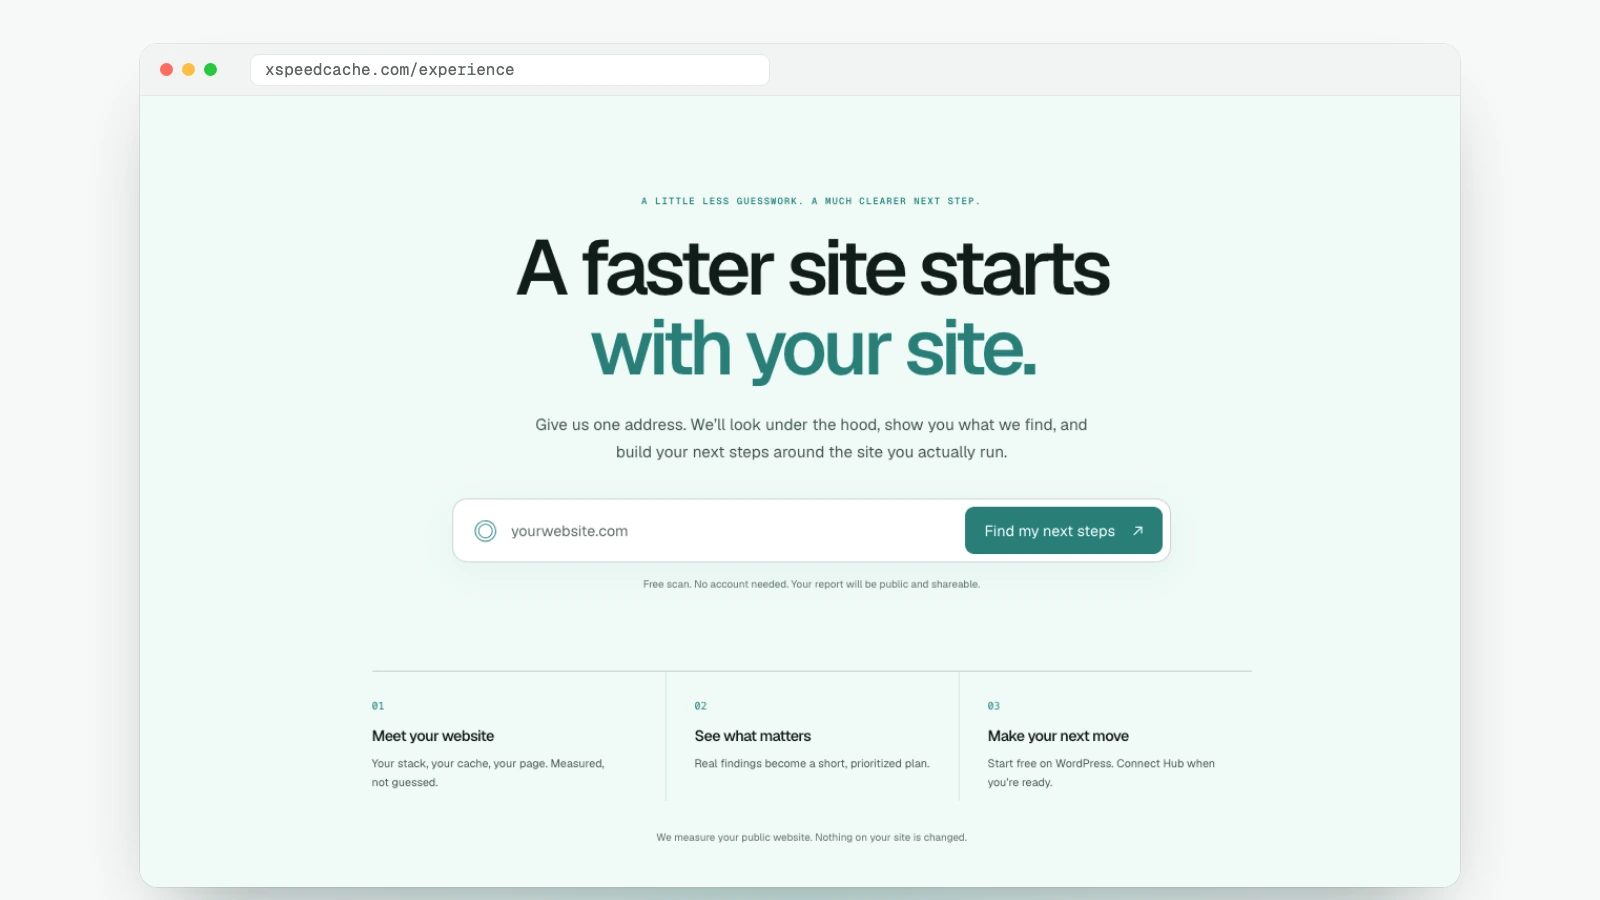
The scan also detects what your site is built on and tailors its advice to it. Every failing check comes with the fix that fits your platform, plus a ready-made prompt you can copy and give to your AI assistant, such as Claude, ChatGPT or Cursor. The assistant reads the prompt and the report and tells you exactly what to do. If your site runs xSpeed Cache and is connected to your assistant through xSpeed Hub, it goes one step further and applies the fixes for you, then re-checks the score.
If your site runs xSpeed Cache and is connected to xSpeed Hub, you also get an alert when your scores drop, so you don’t have to remember to re-scan.
- Good at: grading the whole setup rather than one page load, turning each problem into a clear next step, and handing the fixes to your AI assistant.
- Watch out for: reports are public by default unless the site is connected to xSpeed Hub.
- Best for: a fast health check of any website on any platform, and for xSpeed Cache users who want their AI assistant to apply the fixes.
- Pricing: free.
2. Google PageSpeed Insights
Type: Simulated tests and real visitor data (from Google’s Chrome UX Report)
PageSpeed Insights runs a Lighthouse lab test on any URL and, when your site has enough Chrome traffic, shows real visitor data from the Chrome User Experience Report (CrUX) above it. It’s the score most clients and SEO tools refer to.
- Good at: quick checks on mobile and desktop, real visitor Core Web Vitals, and a list of specific improvements.
- Watch out for: no history or alerts, no choice of test location, and no field data for new or low-traffic sites.
- Best for: a free, trusted first look at any page.
- Pricing: free.
3. GTmetrix
Type: Simulated tests, plus real visitor data from Google’s Chrome UX Report
GTmetrix runs Lighthouse-based tests and adds a detailed waterfall chart that shows every file your page loads and how long each one takes. Accounts keep a history of your tests and can monitor pages on a schedule.
- Good at: finding exactly which file or script is slowing a page down, and comparing tests over time.
- Watch out for: more test locations, devices and frequent monitoring need a paid plan.
- Best for: developers and site owners who want to dig into the details.
- Pricing: free account, with paid plans for more.
4. WebPageTest
Type: Simulated tests, from locations you choose
WebPageTest, now part of Catchpoint, is the deep-dive tool performance specialists rely on. You choose the test location, browser and connection speed, then get a waterfall, a filmstrip of how the page draws on screen, and detailed timings.
- Good at: testing from different countries and connection speeds, and seeing exactly what happens frame by frame.
- Watch out for: a steeper learning curve, and advanced features need a paid plan.
- Best for: developers running detailed audits.
- Pricing: free with limits, plus paid plans.
5. Chrome DevTools
Type: Simulated tests, run in your own browser
Chrome’s built-in developer tools include Lighthouse and a Performance panel that shows Core Web Vitals live as you click around your own site. The Network tab also shows each file’s size and response headers, including whether a page came from cache.
- Good at: testing changes while you build, and checking cache headers.
- Watch out for: results reflect your own computer and connection, and it takes some technical knowledge.
- Best for: developers and anyone testing before going live.
- Pricing: free.
6. Pingdom
Type: Uptime checks, simulated tests and real visitor monitoring
Pingdom checks whether your site is up from locations around the world and alerts you when it isn’t. It also offers page speed checks and real user monitoring.
- Good at: reliable uptime alerts and simple, shareable reports.
- Watch out for: less guidance on fixing speed problems, and ongoing monitoring is paid.
- Best for: businesses that need to know the moment their site goes down.
- Pricing: free speed test, with paid monitoring plans.
7. Contentsquare
Type: Real visitor behavior and experience analytics
Contentsquare is a digital experience analytics platform. Rather than testing speed directly, it shows how real visitors behave on your site, with heatmaps, session replays and journey analysis, and connects that behavior to performance and conversions.
- Good at: showing whether slow or broken pages are costing you conversions, and where visitors get stuck.
- Watch out for: it isn’t a speed testing tool, and it’s priced for larger businesses.
- Best for: large sites and teams focused on user experience and conversion rates.
- Pricing: custom pricing.
8. BrowserStack
Type: Testing on real devices (no speed metrics)
BrowserStack lets you open your site on thousands of real phones, tablets and browsers in the cloud. It’s not a performance monitoring tool, but it shows how your pages actually look and behave on devices you don’t own.
- Good at: catching layout, display and compatibility problems on specific devices and browsers.
- Watch out for: it doesn’t track Core Web Vitals or alert you to slowdowns.
- Best for: QA teams and agencies testing sites across many devices before and after changes.
- Pricing: paid plans, with a free trial.
Comparison at a Glance
| Tool | Simulated Tests | Real Visitor Data | History | Performance Alerts | Uptime Monitoring | Pricing |
|---|---|---|---|---|---|---|
| xSpeed Scan | Yes | Yes (with enough traffic) | Yes | Yes (with xSpeed Hub) | No | Free |
| PageSpeed Insights | Yes | Yes (with enough traffic) | No | No | No | Free |
| GTmetrix | Yes | Yes (with enough traffic) | Yes | Yes | No | Free + paid |
| WebPageTest | Yes | No | Yes | Limited | No | Free + paid |
| Chrome DevTools | Yes | No | No | No | No | Free |
| Pingdom | Yes | Yes (paid plans) | Yes | Yes | Yes | Free test + paid |
| Contentsquare | No | Yes | Yes | Yes | No | Custom pricing |
| BrowserStack | No (real devices only) | No | No | No | No | Paid + free trial |
Two Ways to Monitor Your Site
There are two ways to keep an eye on performance. You can follow a manual routine with the tools above, or let xSpeed Scan and your AI assistant do most of the work for you.
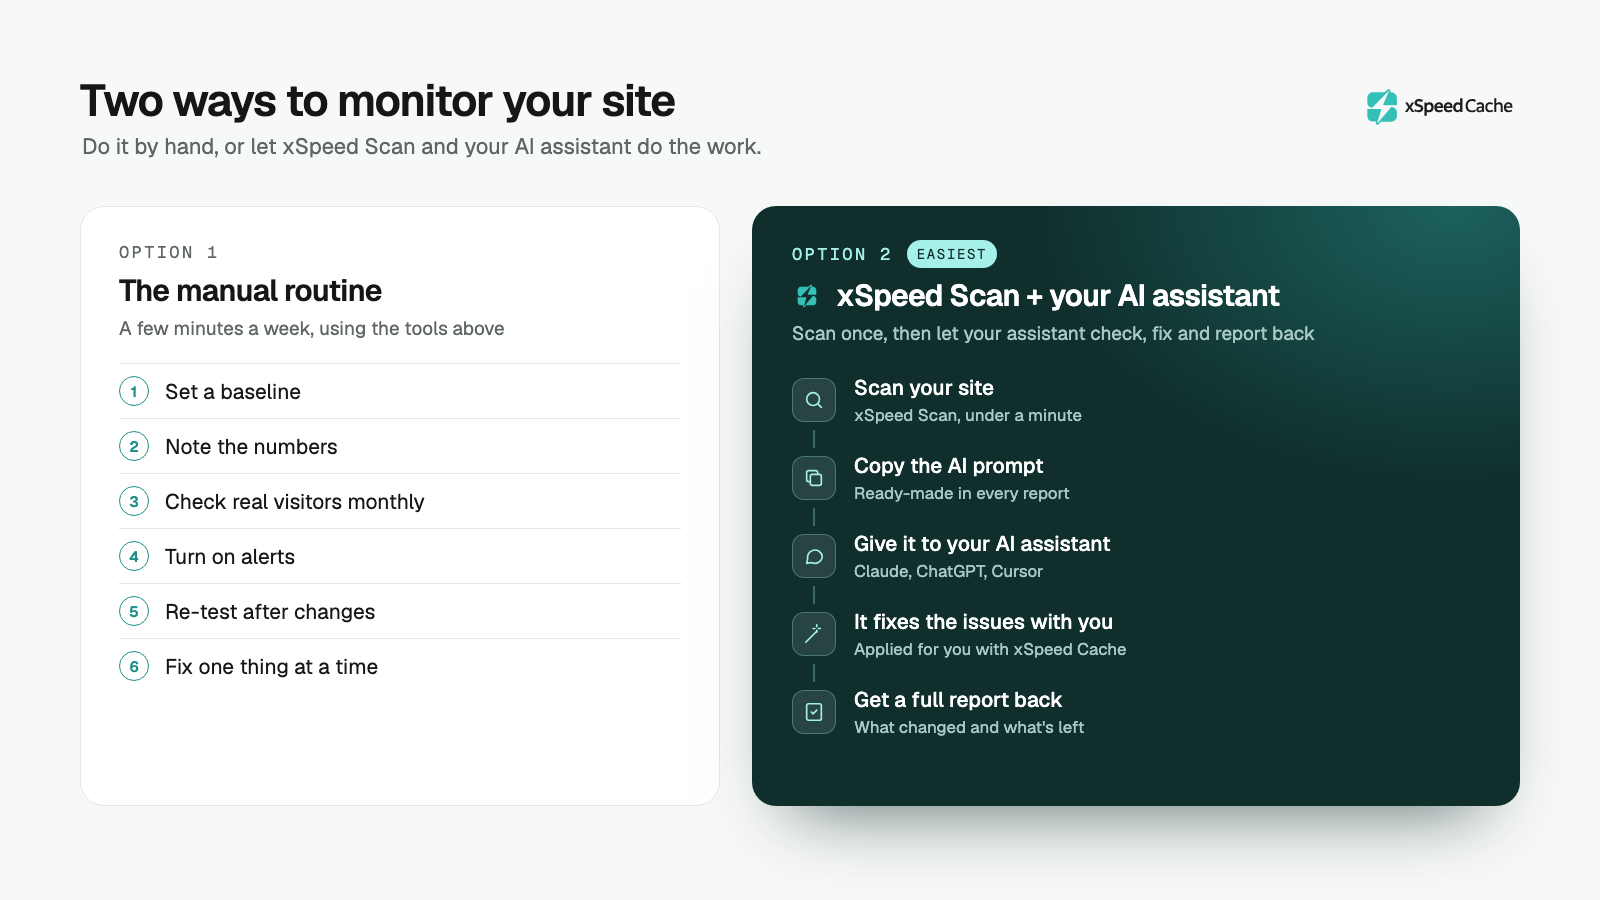
Option 1: The manual routine
You don’t need to watch dashboards every day. This routine takes a few minutes a week:
- Set a baseline. Run xSpeed Scan or PageSpeed Insights on your home page and two or three key pages, such as a popular post and a product page. Test mobile first, since it’s usually slower.
- Write down the numbers that matter. Note LCP, CLS, TBT, TTFB, page weight and the score. Run each test three times and keep the middle result, because single runs vary.
- Check real visitor data monthly. Open the Core Web Vitals report in Google Search Console, or use real visitor monitoring in xSpeed Cache Pro, to see how real people experience the site.
- Turn on alerts. Use xSpeed Hub, GTmetrix or Pingdom so you hear about problems the day they start, not weeks later.
- Re-test after every big change. Plugin updates, theme changes and new scripts are the most common causes of a slowdown. Compare the new result with your baseline.
- Fix one thing at a time. Change one setting, re-test, and keep notes. That way you always know what helped.
For a full step-by-step diagnosis when you find a problem, follow our performance audit guide.
Option 2: The easy way, with xSpeed Scan and your AI assistant
If you’d rather not track numbers and settings by hand, xSpeed Scan and your AI assistant can handle most of the routine with you:
- Scan your site. Run xSpeed Scan on your website. It checks speed, real visitor data, caching and your server in under a minute.
- Copy the AI prompt. Every report comes with a ready-made prompt that describes what the scan found and what to fix.
- Give it to your AI assistant. Paste the prompt into Claude, ChatGPT, Cursor or the AI assistant you already use.
- Fix it together. Your assistant reads the report, explains each problem in plain words and walks you through the fixes. If your site runs xSpeed Cache and is connected to your assistant through xSpeed Hub, it can apply the fixes for you.
- Get a full report back. The assistant re-checks your score and tells you what changed, what improved and what’s left to do.
- Stay covered. With xSpeed Hub connected, you get an alert when your scores drop, so you know when it’s time to scan again.
It’s the same routine, with your AI assistant doing the checking, fixing and re-testing.
From Monitoring to Fixes
Monitoring tools tell you what is wrong. You still need to fix it. Most problems they flag fall into a few groups:
| What the tool flags | What usually fixes it |
|---|---|
| Slow server response (high TTFB) | Page caching, object caching or better hosting |
| Slow main content (poor LCP) | Preloading the main image, modern image formats, Critical CSS |
| Render-blocking CSS and JavaScript | Deferring or delaying scripts, removing unused CSS |
| Layout shifts (poor CLS) | Setting image sizes and handling font loading |
| Heavy pages | Image compression, lazy loading, fewer third-party scripts |
xSpeed Scan names the right fix for each problem, whatever your site is built on. If your site runs WordPress, xSpeed Cache covers these fixes, and the scan maps every failing check to the xSpeed feature that solves it. If your site is connected to an AI assistant through xSpeed Hub, the assistant can apply the fixes from a scan report and re-check the score for you.
Frequently Asked Questions
What is website performance monitoring?
It’s the practice of checking your site’s speed and stability on a regular schedule. Instead of one test, you track key metrics over time and get warned when they get worse, so you can fix problems before they affect visitors or rankings.
What’s the difference between lab data and field data?
Lab data comes from a test machine loading your page under fixed conditions. It’s ideal for finding problems and checking fixes. Field data comes from real visitors on their own devices and networks. It shows what people actually experience, but it needs traffic and updates more slowly.
Which metrics should I monitor?
Start with the three Core Web Vitals: LCP, INP and CLS. Add Time to First Byte for server speed, page weight, your cache hit ratio and uptime. Together they explain most changes in your performance score.
How often should I check my website’s performance?
A quick check once a week is enough for most sites, plus a test after every major plugin, theme or design change. Check real visitor data once a month, and use alerts so you don’t have to remember.
What’s the best free website speed test?
xSpeed Scan is the best free place to start. It works on any website, combines Google’s lab test and real visitor data with server and caching checks, and gives you the fix for every problem it finds, plus a ready-made prompt for your AI assistant. PageSpeed Insights is also free and shows Google’s own lab and real visitor results for a single page.
Can a monitoring tool make my site faster?
Not on its own. Most monitoring tools find problems but leave the fixing to you, usually with caching, image optimization and script optimization from a performance plugin such as xSpeed Cache. xSpeed Scan goes further: give its ready-made prompt to your AI assistant, and on a site running xSpeed Cache and connected through xSpeed Hub, the assistant can apply the fixes and re-check the score for you.
How do I monitor many sites at once?
Use a fleet dashboard rather than testing each site by hand. Uptime tools like Pingdom and monitoring in GTmetrix can watch several sites at once. If your sites run WordPress, xSpeed Hub connects all your sites to one place, checks them every day and alerts you by Slack or email when something goes wrong.
Start Monitoring Today
The best monitoring setup is the one you’ll actually use. For most sites, that means a free speed test for quick checks, real visitor data for the full picture, and alerts so problems come to you.
Start with a baseline. Scan your site to see how fast it is right now, then hand the report to your AI assistant and let it walk you through what to fix first.